
- Home >
- Stock Photos >
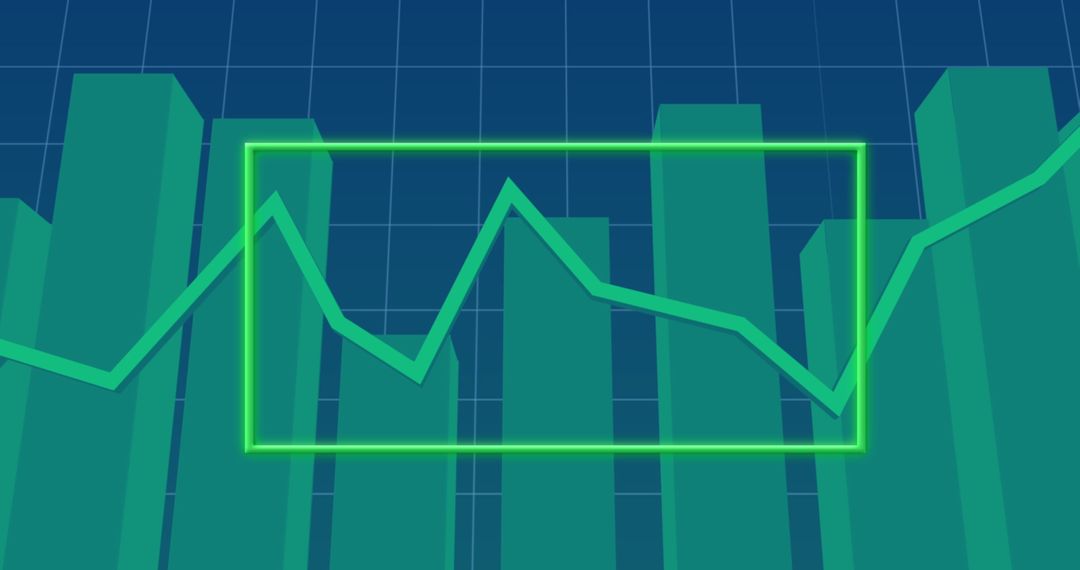
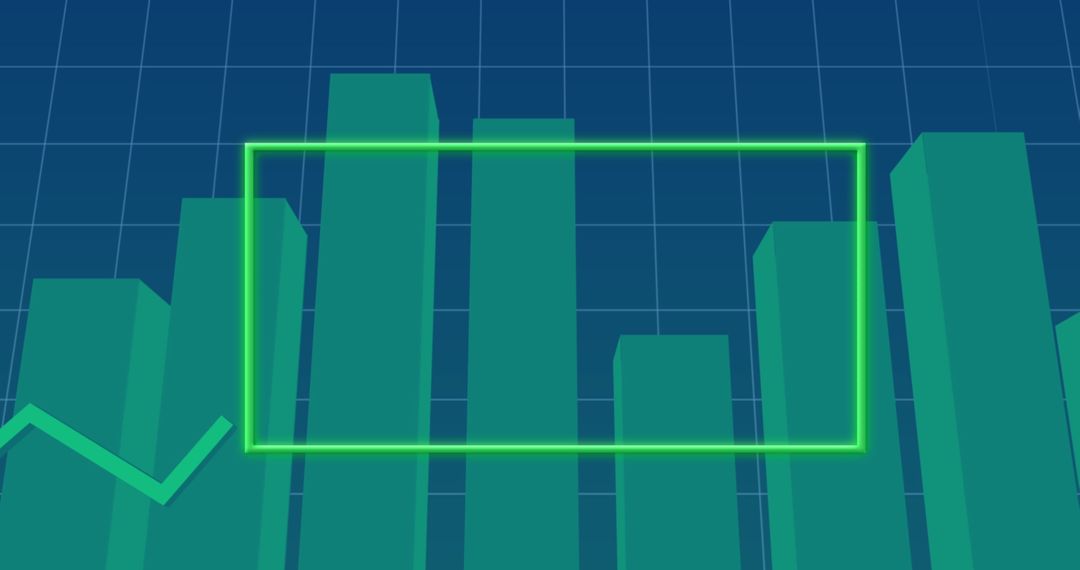
- Green Fintech Dashboard with Rising 3D Bar Charts and Jagged Trend Line on Dark Grid
Green Fintech Dashboard with Rising 3D Bar Charts and Jagged Trend Line on Dark Grid Image

Depicting green 3D bar charts over dark grid with jagged trend line suggesting market fluctuation and growth potential. Using strong vertical bars and diagonal trend line to convey data-driven business performance and volatility. Creating tech-forward, secure mood with deep green palette and neon cyan accents. Working well for fintech website hero, analytics dashboard concept, investor presentation slides, financial report covers, cybersecurity briefings, app UI backgrounds, and marketing banners. Leaving generous negative space at top and left for headline or overlay text. Offering high contrast elements for clear legibility on web and print. Advising use in color-themed layouts, corporate annual reports, blog headers, social posts, and pitch decks.
Powered by  - Get 15% off with code: PIKWIZARD15


0
downloads
downloads
Tags:
More
Credit Photo
If you would like to credit the Photo, here are some ways you can do so
Text Link
photo Link
<span class="text-link">
<span>
<a target="_blank" href=https://pikwizard.com/photo/green-fintech-dashboard-with-rising-3d-bar-charts-and-jagged-trend-line-on-dark-grid/03309f50d9dc9cbfaf42e82316e83c3f/>PikWizard</a>
</span>
</span>
<span class="image-link">
<span
style="margin: 0 0 20px 0; display: inline-block; vertical-align: middle; width: 100%;"
>
<a
target="_blank"
href="https://pikwizard.com/photo/green-fintech-dashboard-with-rising-3d-bar-charts-and-jagged-trend-line-on-dark-grid/03309f50d9dc9cbfaf42e82316e83c3f/"
style="text-decoration: none; font-size: 10px; margin: 0;"
>
<img src="https://pikwizard.com/pw/medium/03309f50d9dc9cbfaf42e82316e83c3f.jpg" style="margin: 0; width: 100%;" alt="" />
<p style="font-size: 12px; margin: 0;">PikWizard</p>
</a>
</span>
</span>
Free (free of charge)
Free for personal and commercial use.
Author: People Creations
Similar Free Stock Images

Premium


Premium


Premium


Premium


Premium


Premium


Premium


Premium


Premium


Premium


Premium


Premium


Premium


Premium


Premium


Premium


Premium


Premium


Premium


Premium


Premium


Premium


Premium


Premium

