- Home >
- Stock Photos >
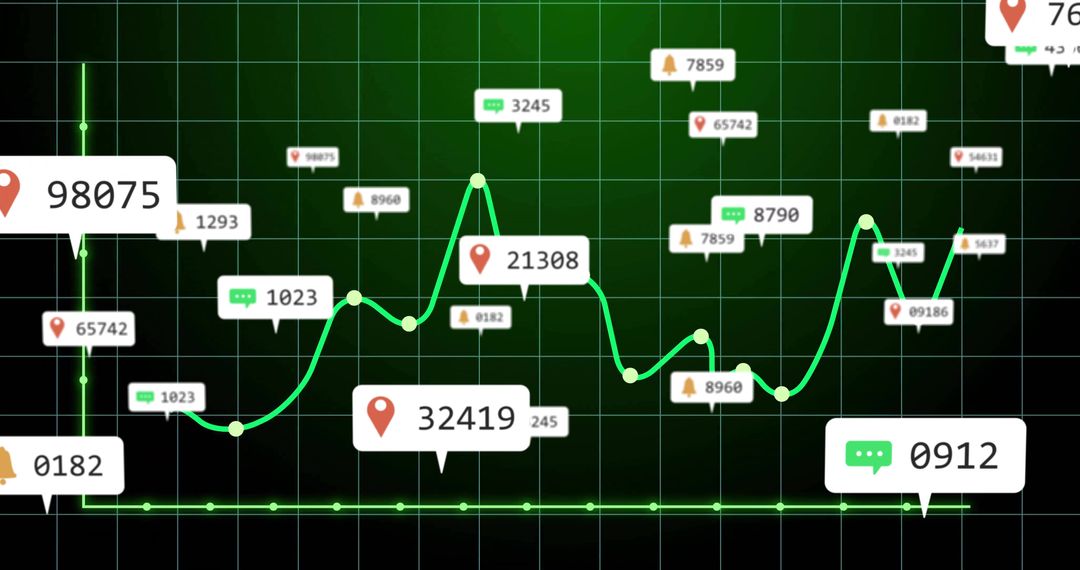
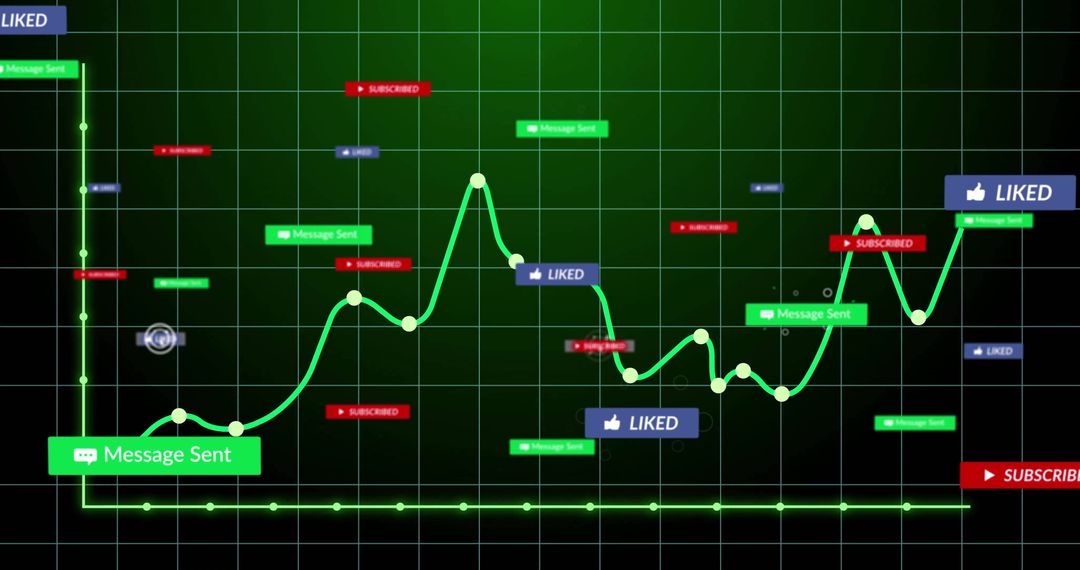
- Green Graph with Thumbs-Up Notifications Symbolizing Positive Data Trends
Green Graph with Thumbs-Up Notifications Symbolizing Positive Data Trends Image

This illustration features a green line graph representing data metrics on an analytics dashboard, interspersed with thumbs-up icons. A tooltip showing the number 55 signifies accumulated positive feedback or likes. Ideal for use in presentations about data analysis, customer feedback systems, and digital marketing performance. It visually conveys positive data trends and user engagement in an easily graspable manner.
Powered by  - Get 15% off with code: PIKWIZARD15


0
downloads
downloads
Tags:
More
Credit Photo
If you would like to credit the Photo, here are some ways you can do so
Text Link
photo Link
<span class="text-link">
<span>
<a target="_blank" href=https://pikwizard.com/photo/green-graph-with-thumbs-up-notifications-symbolizing-positive-data-trends/eb7fbec48dd5b561ada05e2003130318/>PikWizard</a>
</span>
</span>
<span class="image-link">
<span
style="margin: 0 0 20px 0; display: inline-block; vertical-align: middle; width: 100%;"
>
<a
target="_blank"
href="https://pikwizard.com/photo/green-graph-with-thumbs-up-notifications-symbolizing-positive-data-trends/eb7fbec48dd5b561ada05e2003130318/"
style="text-decoration: none; font-size: 10px; margin: 0;"
>
<img src="https://pikwizard.com/pw/medium/eb7fbec48dd5b561ada05e2003130318.jpg" style="margin: 0; width: 100%;" alt="" />
<p style="font-size: 12px; margin: 0;">PikWizard</p>
</a>
</span>
</span>
Free (free of charge)
Free for personal and commercial use.
Author: Creative Art
Similar Free Stock Images
Premium


Premium


Premium


Premium


Premium


Premium


Premium


Premium


Premium


Premium


Premium


Premium


Premium


Premium


Premium


Premium


Premium


Premium


Premium


Premium


Premium


Premium


Premium


Premium