- Home >
- Stock Photos >
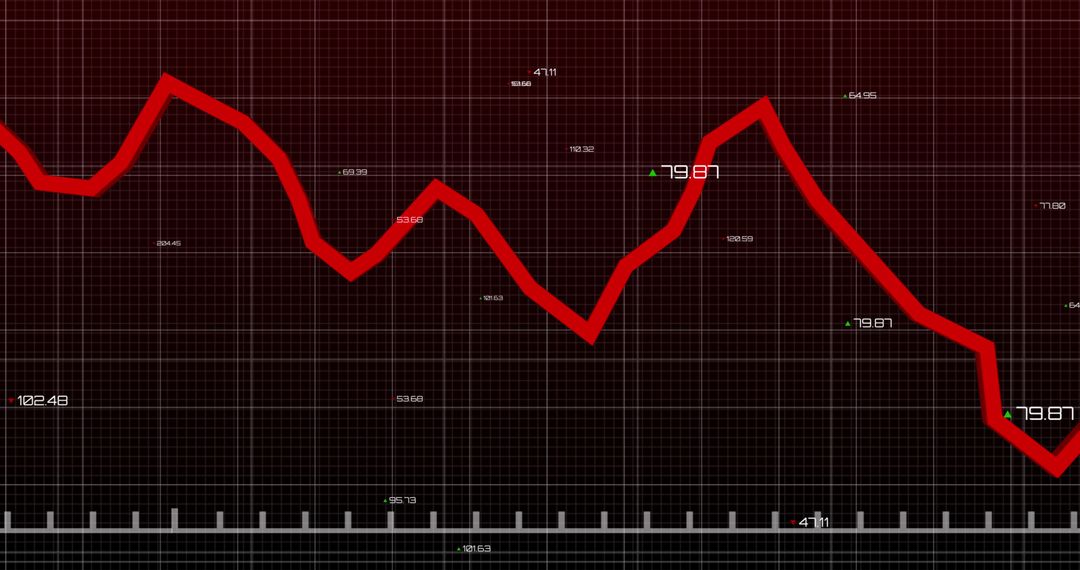
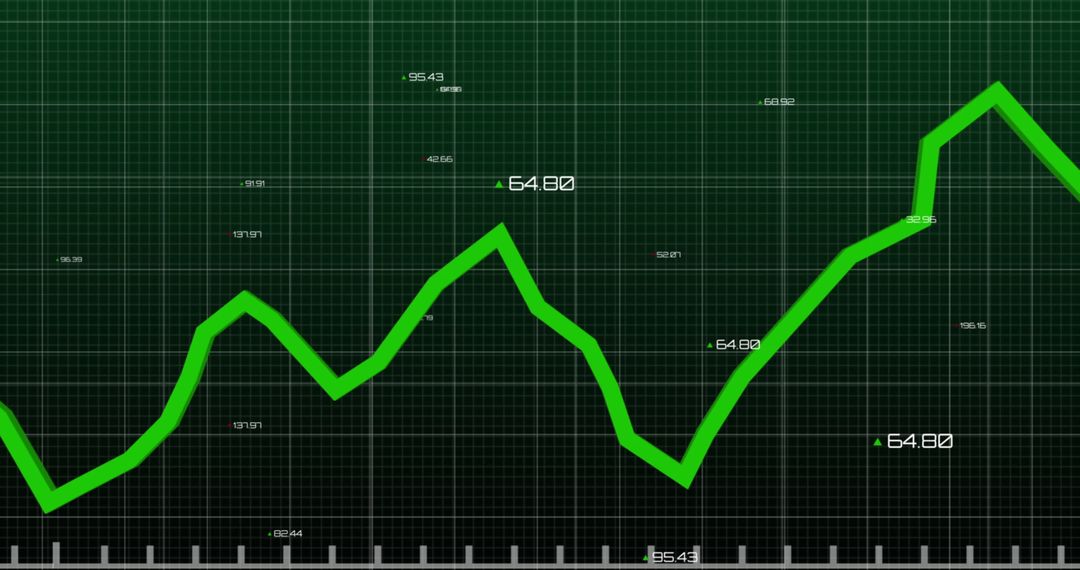
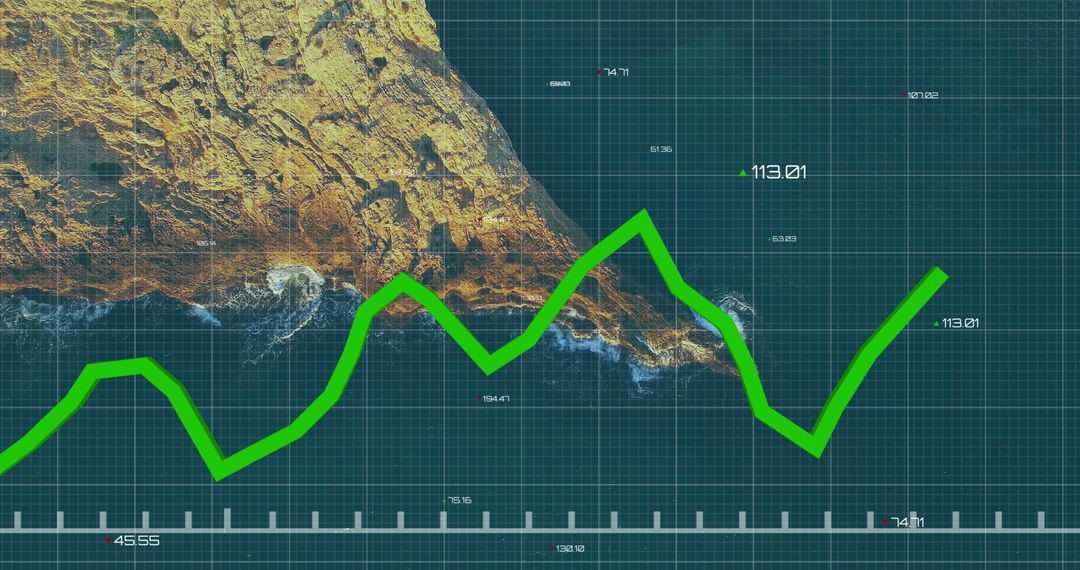
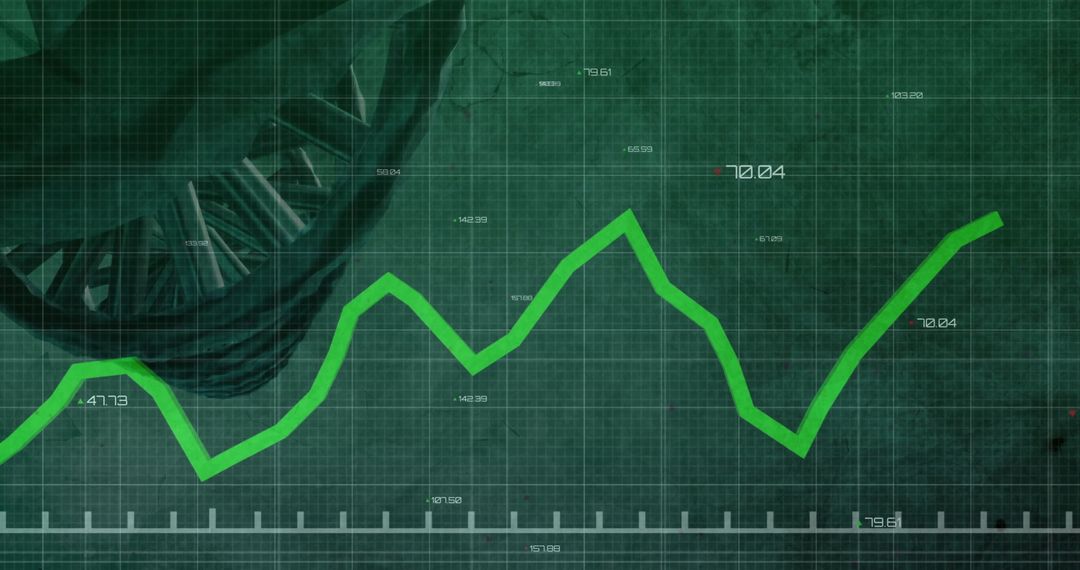
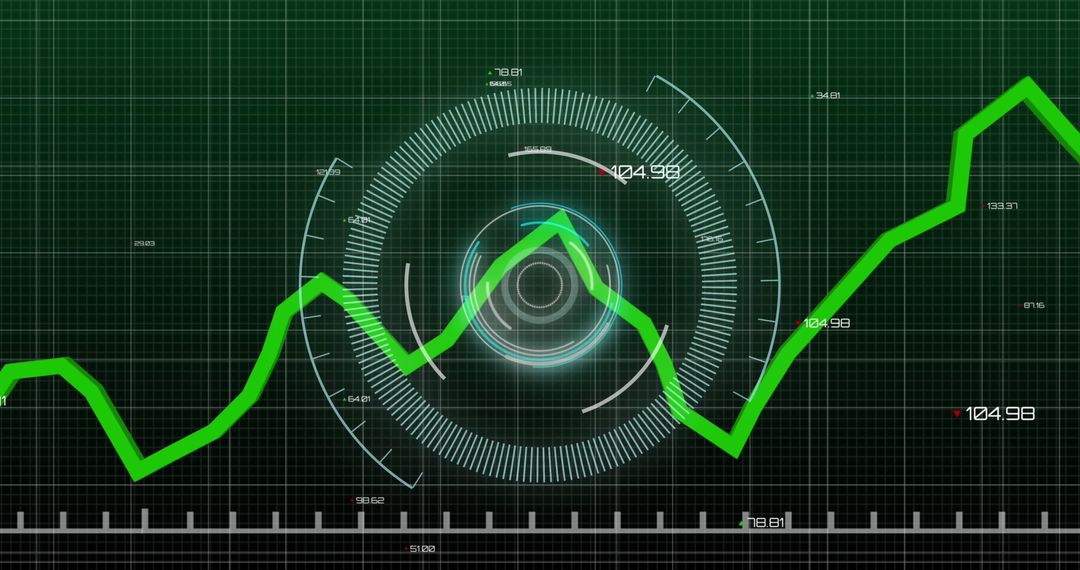
- Green Line Chart on Digital Grid with Financial Data Points
Green Line Chart on Digital Grid with Financial Data Points Image

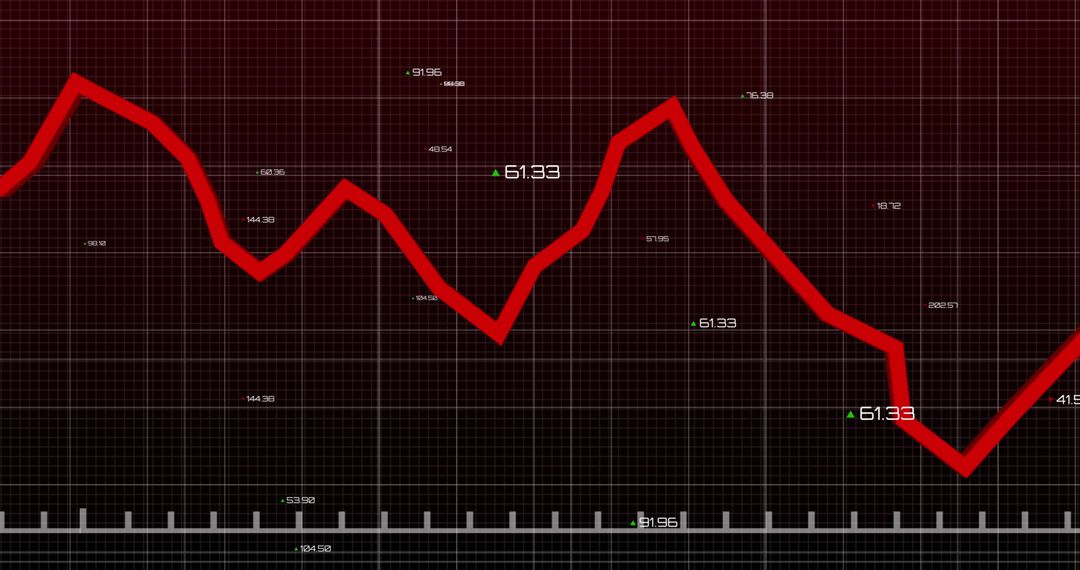
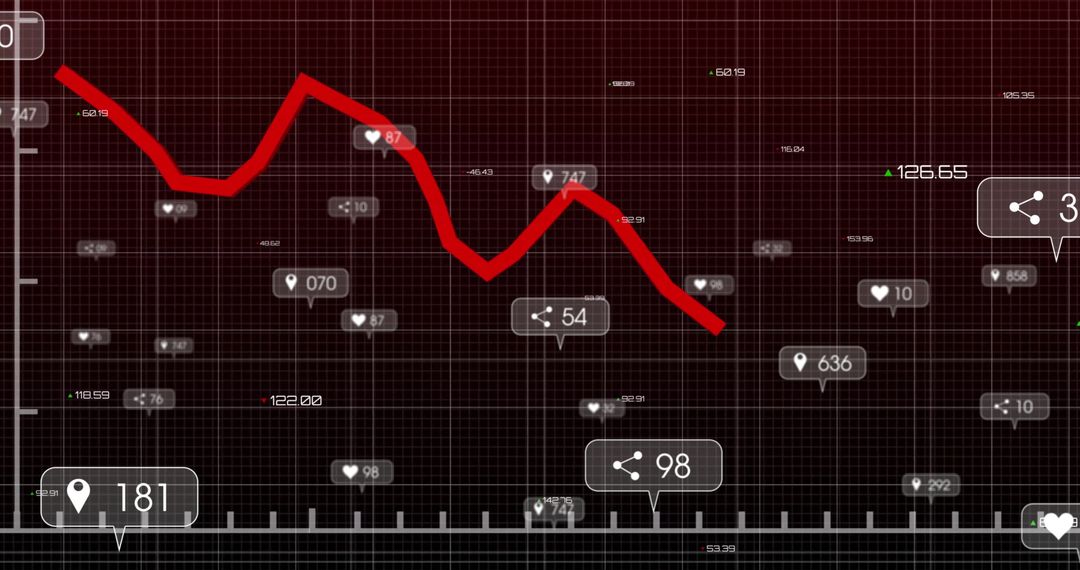
Presenting a green zigzagging line chart against a dark green digital grid, emphasizing visually the presentation of fluctuating numerical data. White numbers scatter across the grid, possibly denoting financial figures or analytic metrics, conveying a sense of real-time market trends and business performance analysis. Ideal for advertising financial services, illustrating data analysis in reports, or adding visual complexity to technology firm brochures and dashboards.
Powered by  - Get 15% off with code: PIKWIZARD15


2
downloads
downloads
Tags:
More
Credit Photo
If you would like to credit the Photo, here are some ways you can do so
Text Link
photo Link
<span class="text-link">
<span>
<a target="_blank" href=https://pikwizard.com/photo/green-line-chart-on-digital-grid-with-financial-data-points/263a629c00b4fd2d30d9990de0d99707/>PikWizard</a>
</span>
</span>
<span class="image-link">
<span
style="margin: 0 0 20px 0; display: inline-block; vertical-align: middle; width: 100%;"
>
<a
target="_blank"
href="https://pikwizard.com/photo/green-line-chart-on-digital-grid-with-financial-data-points/263a629c00b4fd2d30d9990de0d99707/"
style="text-decoration: none; font-size: 10px; margin: 0;"
>
<img src="https://pikwizard.com/pw/medium/263a629c00b4fd2d30d9990de0d99707.jpg" style="margin: 0; width: 100%;" alt="" />
<p style="font-size: 12px; margin: 0;">PikWizard</p>
</a>
</span>
</span>
Free (free of charge)
Free for personal and commercial use.
Author: Awesome Content
Similar Free Stock Images
Premium


Premium


Premium


Premium


Premium


Premium


Premium


Premium


Premium


Premium


Premium


Premium


Premium


Premium


Premium


Premium


Premium


Premium


Premium


Premium


Premium


Premium


Premium


Premium