- Home >
- Stock Photos >
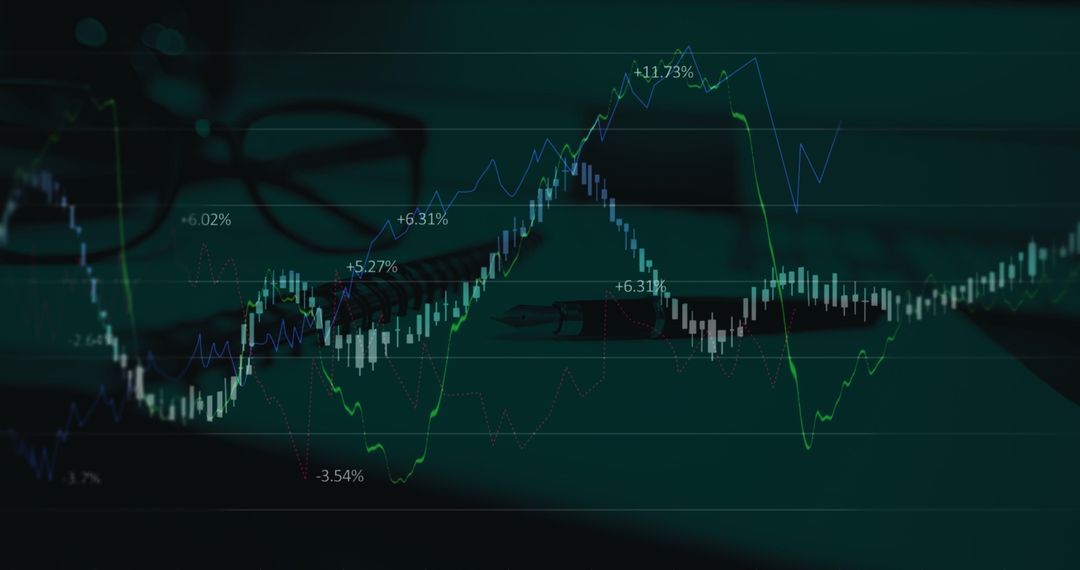
- Green Line Chart Overlay on Hazy Cityscape
Green Line Chart Overlay on Hazy Cityscape Image

This image presents a green line chart overlaid on a hazy city skyline, emphasizing concepts of data visualization, analytics, and financial growth. Suitable for illustrating modern technology and urban studies, this visual can be utilized in presentations on economic analysis, digital innovations, or market trends.
Powered by 


0
downloads
downloads
Tags:
More
Credit Photo
If you would like to credit the Photo, here are some ways you can do so
Text Link
photo Link
<span class="text-link">
<span>
<a target="_blank" href=https://pikwizard.com/photo/green-line-chart-overlay-on-hazy-cityscape/5b4e2324ae0fb880fdca55676f1447e4/>PikWizard</a>
</span>
</span>
<span class="image-link">
<span
style="margin: 0 0 20px 0; display: inline-block; vertical-align: middle; width: 100%;"
>
<a
target="_blank"
href="https://pikwizard.com/photo/green-line-chart-overlay-on-hazy-cityscape/5b4e2324ae0fb880fdca55676f1447e4/"
style="text-decoration: none; font-size: 10px; margin: 0;"
>
<img src="https://pikwizard.com/pw/medium/5b4e2324ae0fb880fdca55676f1447e4.jpg" style="margin: 0; width: 100%;" alt="" />
<p style="font-size: 12px; margin: 0;">PikWizard</p>
</a>
</span>
</span>
Free (free of charge)
Free for personal and commercial use.
Author: Creative Art
Similar Free Stock Images

Premium


Premium


Premium


Premium


Premium


Premium


Premium


Premium


Premium


Premium


Premium


Premium


Premium


Premium


Premium


Premium


Premium


Premium


Premium


Premium


Premium


Premium


Premium


Premium