
- Home >
- Stock Photos >
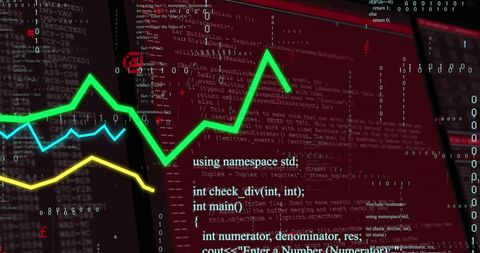
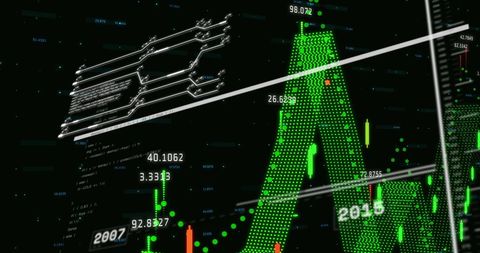
- Green Line Chart with Financial Data on Dark Background
Green Line Chart with Financial Data on Dark Background Image

Dynamic image featuring a green line chart overlaid with financial data strings symbolizing real-time data processing. Perfect for illustrating concepts of finance, investment, stock market analysis, global economics, or a digital business interface. Suitable for use in financial reports, investment presentations, or digital marketing materials related to finance.
Powered by 


downloads
Tags:
More
Credit Photo
If you would like to credit the Photo, here are some ways you can do so
Text Link
photo Link
<span class="text-link">
<span>
<a target="_blank" href=https://pikwizard.com/photo/green-line-chart-with-financial-data-on-dark-background/684b4b5096bdee646d760bbe3a2aa653/>PikWizard</a>
</span>
</span>
<span class="image-link">
<span
style="margin: 0 0 20px 0; display: inline-block; vertical-align: middle; width: 100%;"
>
<a
target="_blank"
href="https://pikwizard.com/photo/green-line-chart-with-financial-data-on-dark-background/684b4b5096bdee646d760bbe3a2aa653/"
style="text-decoration: none; font-size: 10px; margin: 0;"
>
<img src="https://pikwizard.com/pw/medium/684b4b5096bdee646d760bbe3a2aa653.jpg" style="margin: 0; width: 100%;" alt="" />
<p style="font-size: 12px; margin: 0;">PikWizard</p>
</a>
</span>
</span>
Free (free of charge)
Free for personal and commercial use.
Author: People Creations
Similar Free Stock Images

Premium


Premium
Premium


Premium

Premium


Premium


Premium


Premium


Premium


Premium


Premium


Premium


Premium

Premium

Premium


Premium


Premium


Premium


Premium


Premium


Premium


Premium


Premium


Premium


Premium


Explore More Free Stock Images