
- Home >
- Stock Photos >
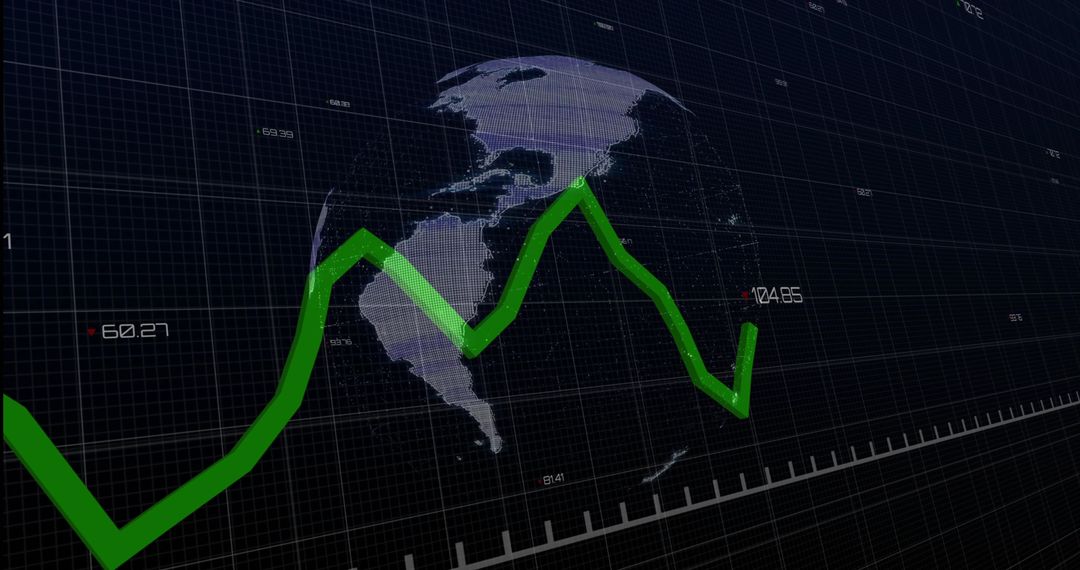
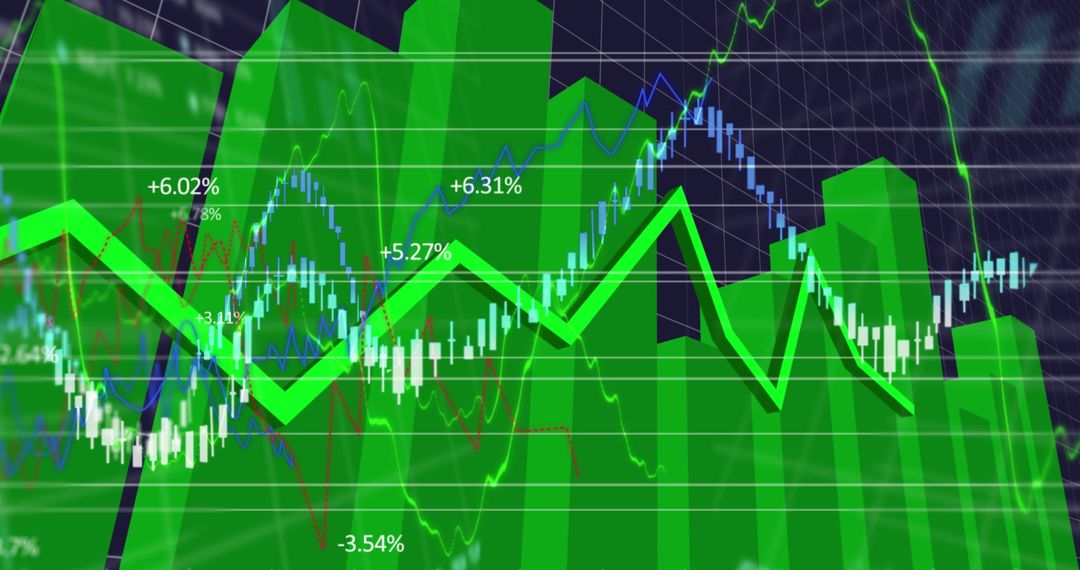
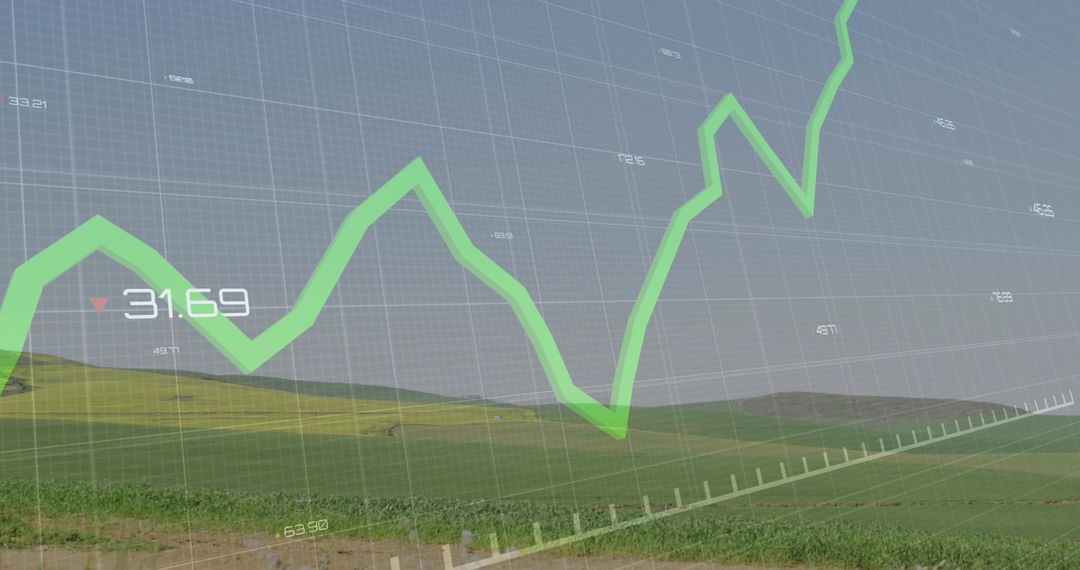
- Green Line Fluctuating on Digital Stock Market Interface with Red Bars
Green Line Fluctuating on Digital Stock Market Interface with Red Bars Image

Illustrates concepts of data analysis and financial market trends with a green fluctuating line on a digital platform with red graph bars and grid lines. Useful for finance-themed presentations, investment blogs, and educational materials focused on business intelligence and economic studies.
Powered by  - Get 15% off with code: PIKWIZARD15


0
downloads
downloads
Tags:
More
Credit Photo
If you would like to credit the Photo, here are some ways you can do so
Text Link
photo Link
<span class="text-link">
<span>
<a target="_blank" href=https://pikwizard.com/photo/green-line-fluctuating-on-digital-stock-market-interface-with-red-bars/bf6a07f60ccf671b6a94211f19e99251/>PikWizard</a>
</span>
</span>
<span class="image-link">
<span
style="margin: 0 0 20px 0; display: inline-block; vertical-align: middle; width: 100%;"
>
<a
target="_blank"
href="https://pikwizard.com/photo/green-line-fluctuating-on-digital-stock-market-interface-with-red-bars/bf6a07f60ccf671b6a94211f19e99251/"
style="text-decoration: none; font-size: 10px; margin: 0;"
>
<img src="https://pikwizard.com/pw/medium/bf6a07f60ccf671b6a94211f19e99251.jpg" style="margin: 0; width: 100%;" alt="" />
<p style="font-size: 12px; margin: 0;">PikWizard</p>
</a>
</span>
</span>
Free (free of charge)
Free for personal and commercial use.
Author: Awesome Content
Similar Free Stock Images

Premium


Premium


Premium


Premium


Premium


Premium


Premium


Premium


Premium


Premium


Premium


Premium


Premium


Premium


Premium


Premium


Premium


Premium


Premium


Premium


Premium


Premium


Premium

Premium

