- Home >
- Stock Photos >
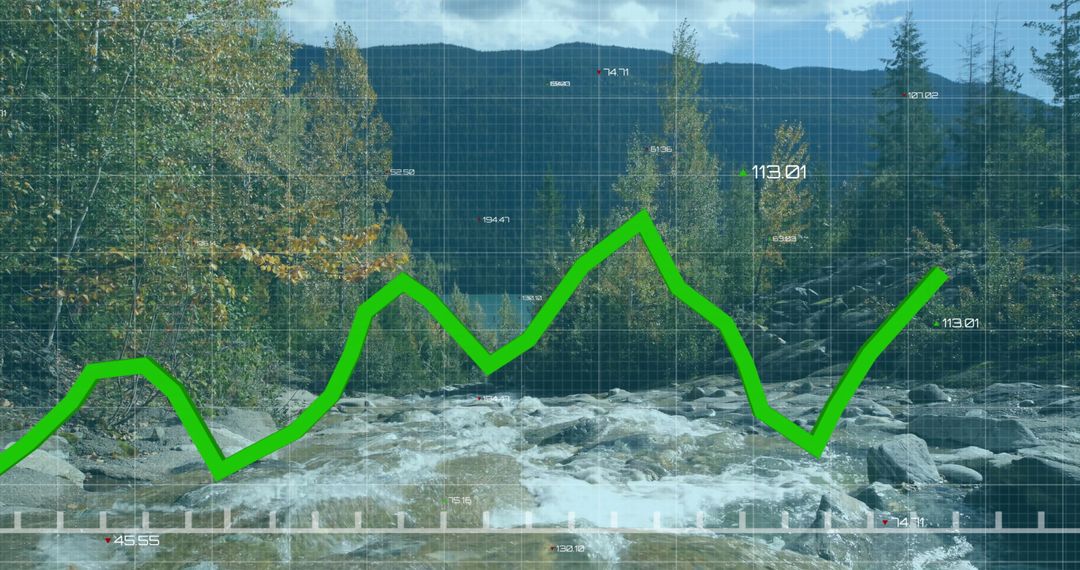
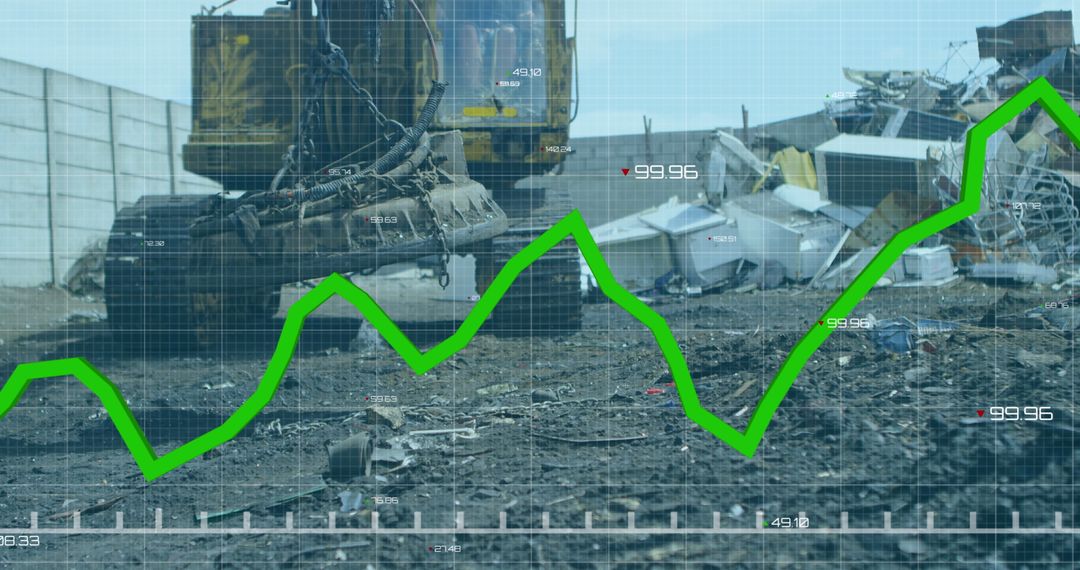
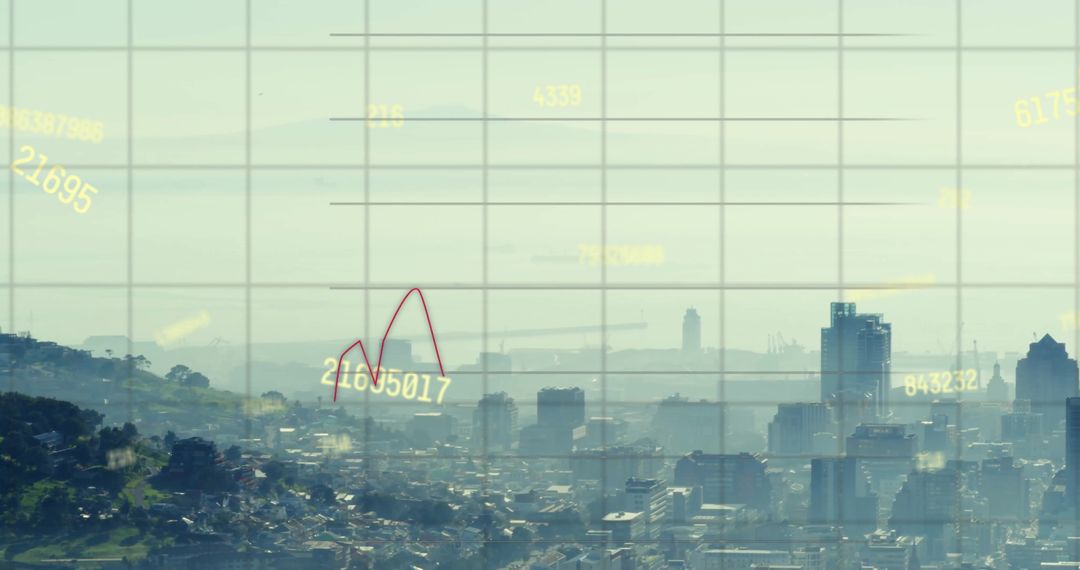
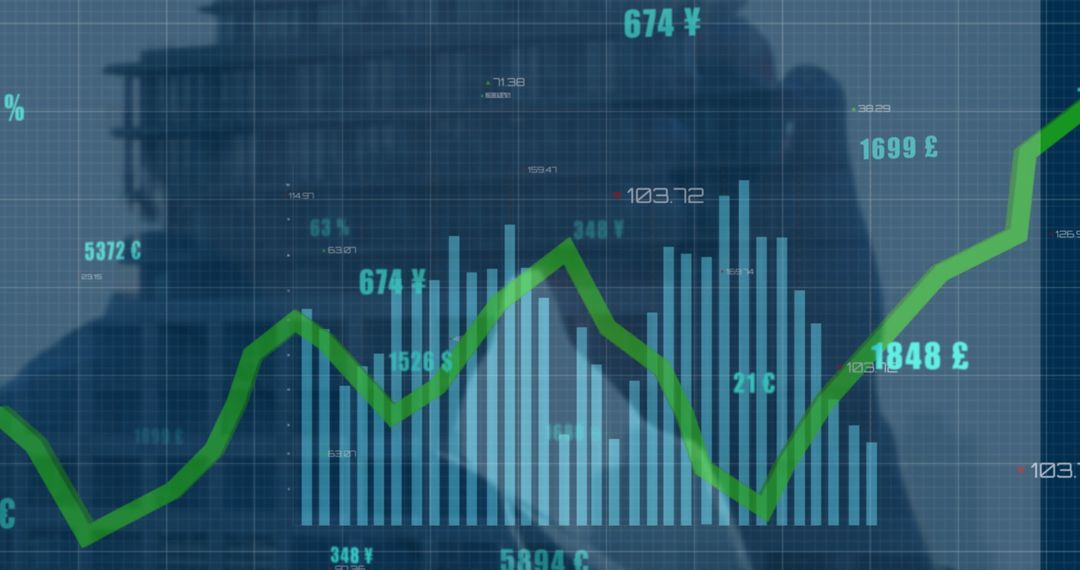
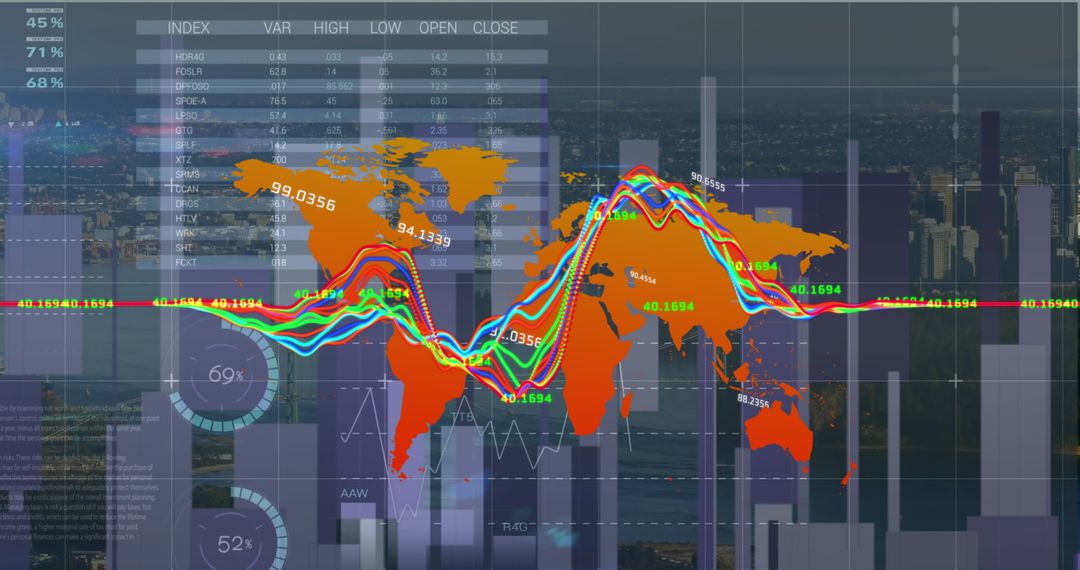
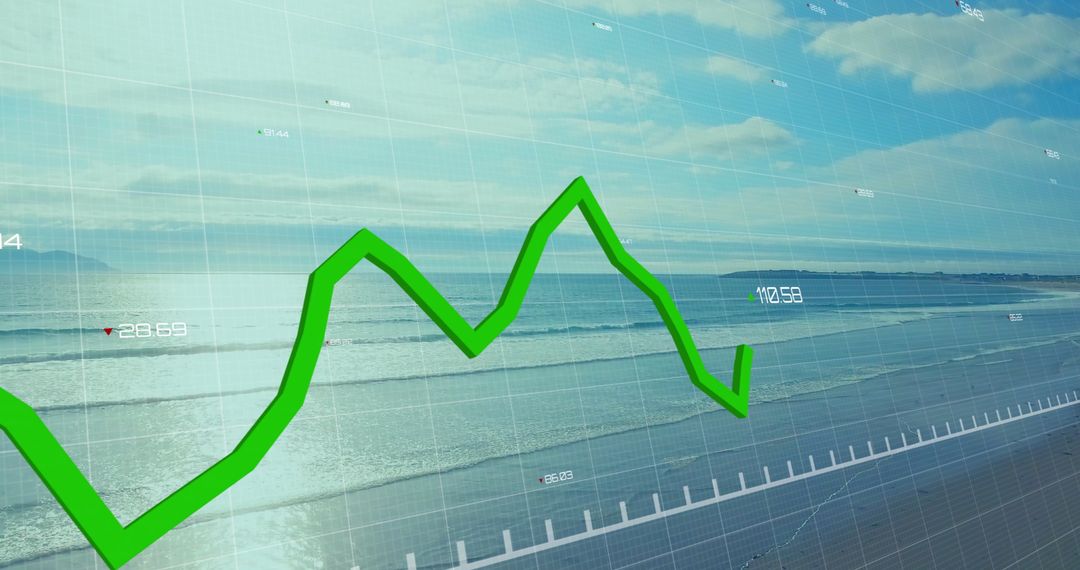
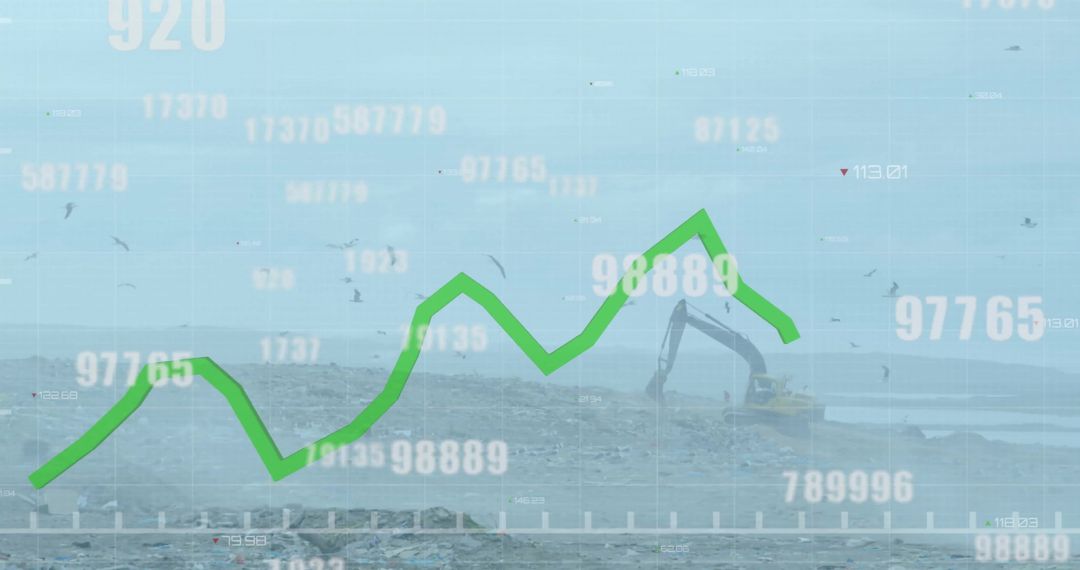
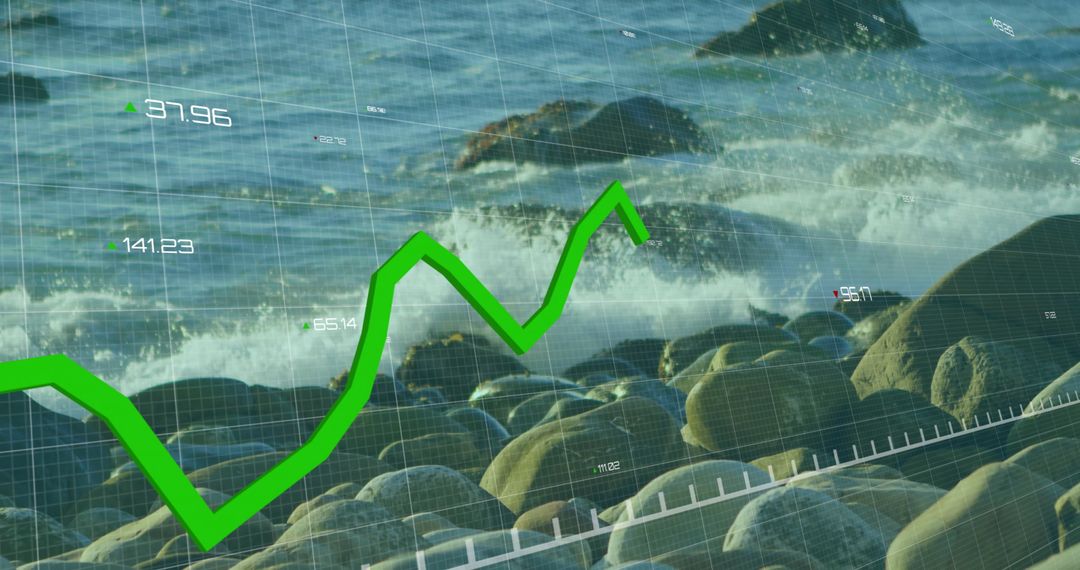
- Green Line Graph and Data Elements on Industrial Landfill
Green Line Graph and Data Elements on Industrial Landfill Image
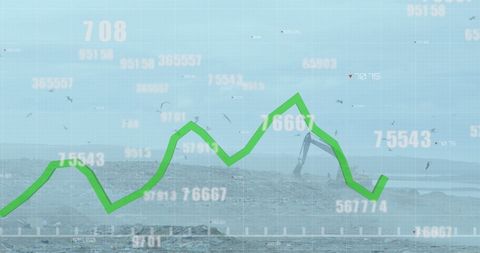
Innovative visual blending data analytics graphics over image of a bulldozer on a landfill. Ideal for projects related to finance trends, environmental concerns, and industrial analysis. Useful for illustrating concepts on economy, waste management or global resource challenges.
Powered by 


4
downloads
downloads
Credit Photo
If you would like to credit the Photo, here are some ways you can do so
Text Link
photo Link
<span class="text-link">
<span>
<a target="_blank" href=https://pikwizard.com/photo/green-line-graph-and-data-elements-on-industrial-landfill/4529de0a1f834a13a4b2bb31262b74f2/>PikWizard</a>
</span>
</span>
<span class="image-link">
<span
style="margin: 0 0 20px 0; display: inline-block; vertical-align: middle; width: 100%;"
>
<a
target="_blank"
href="https://pikwizard.com/photo/green-line-graph-and-data-elements-on-industrial-landfill/4529de0a1f834a13a4b2bb31262b74f2/"
style="text-decoration: none; font-size: 10px; margin: 0;"
>
<img src="https://pikwizard.com/pw/medium/4529de0a1f834a13a4b2bb31262b74f2.jpg" style="margin: 0; width: 100%;" alt="" />
<p style="font-size: 12px; margin: 0;">PikWizard</p>
</a>
</span>
</span>
Free (free of charge)
Free for personal and commercial use.
Author: Creative Art
Similar Free Stock Images
Premium


Premium


Premium


Premium


Premium


Premium


Premium


Premium


Premium


Premium


Premium


Premium


Premium


Premium


Premium


Premium


Premium


Premium


Premium


Premium


Premium


Premium


Premium


Premium