- Home >
- Stock Photos >
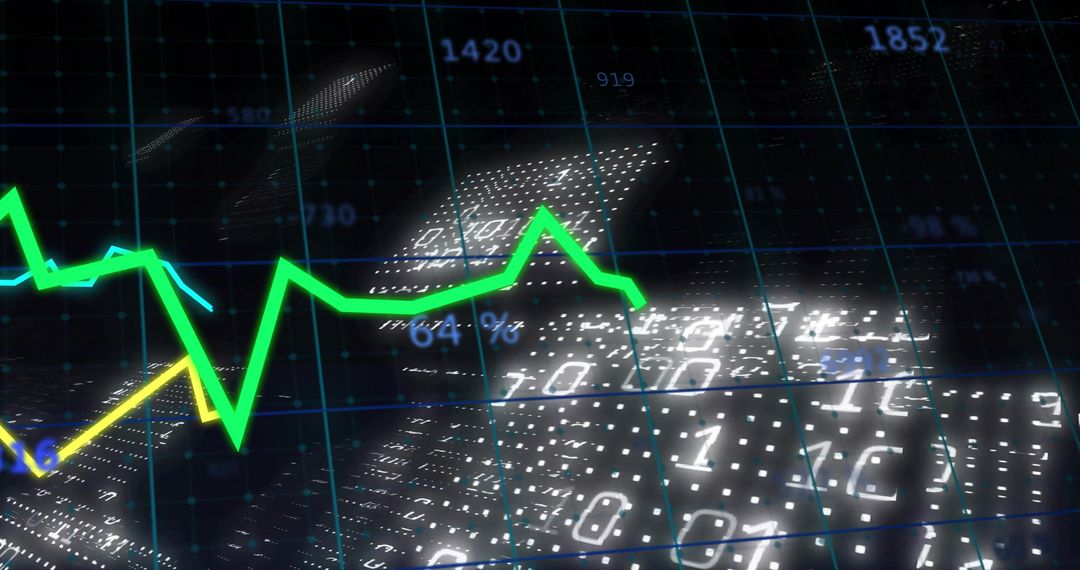
- Green Line Graph Displaying Financial Market Trends on Digital Screen
Green Line Graph Displaying Financial Market Trends on Digital Screen Image

Graphic shows a green line graph on a digital screen with detailed financial data, trend fluctuations and market statistics. Useful for illustrating concepts of finance growth and investments. Ideal for use in economic reports, financial analytics presentations and market trend documentation.
Powered by 


2
downloads
downloads
Tags:
More
Credit Photo
If you would like to credit the Photo, here are some ways you can do so
Text Link
photo Link
<span class="text-link">
<span>
<a target="_blank" href=https://pikwizard.com/photo/green-line-graph-displaying-financial-market-trends-on-digital-screen/c60bd30256110fe3d904539cc126f879/>PikWizard</a>
</span>
</span>
<span class="image-link">
<span
style="margin: 0 0 20px 0; display: inline-block; vertical-align: middle; width: 100%;"
>
<a
target="_blank"
href="https://pikwizard.com/photo/green-line-graph-displaying-financial-market-trends-on-digital-screen/c60bd30256110fe3d904539cc126f879/"
style="text-decoration: none; font-size: 10px; margin: 0;"
>
<img src="https://pikwizard.com/pw/medium/c60bd30256110fe3d904539cc126f879.jpg" style="margin: 0; width: 100%;" alt="" />
<p style="font-size: 12px; margin: 0;">PikWizard</p>
</a>
</span>
</span>
Free (free of charge)
Free for personal and commercial use.
Author: People Creations
Similar Free Stock Images

Premium


Premium


Premium


Premium


Premium


Premium


Premium


Premium


Premium


Premium


Premium


Premium


Premium


Premium


Premium


Premium


Premium


Premium


Premium


Premium


Premium


Premium


Premium


Premium