- Home >
- Stock Photos >
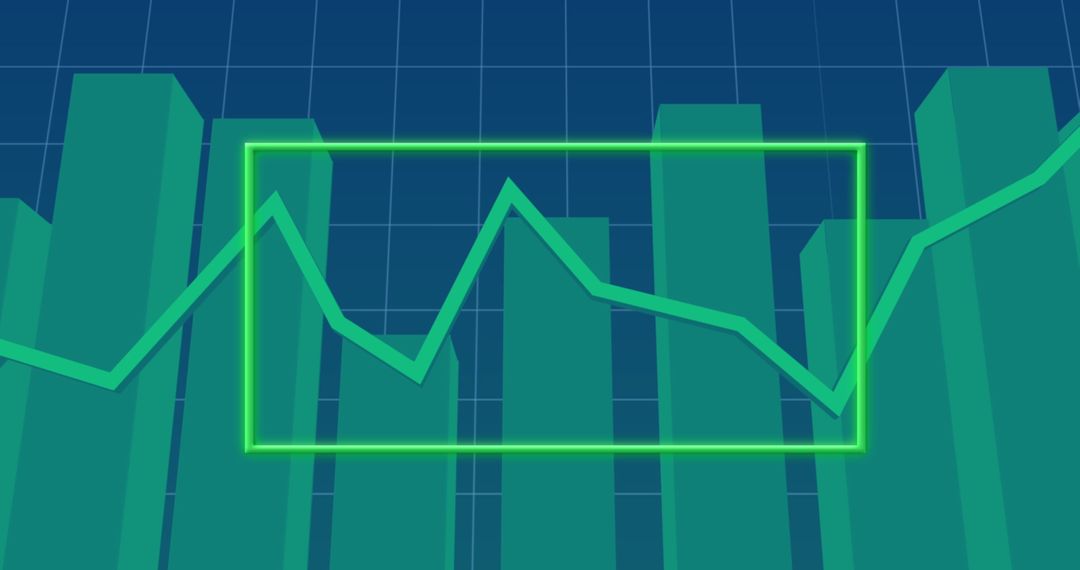
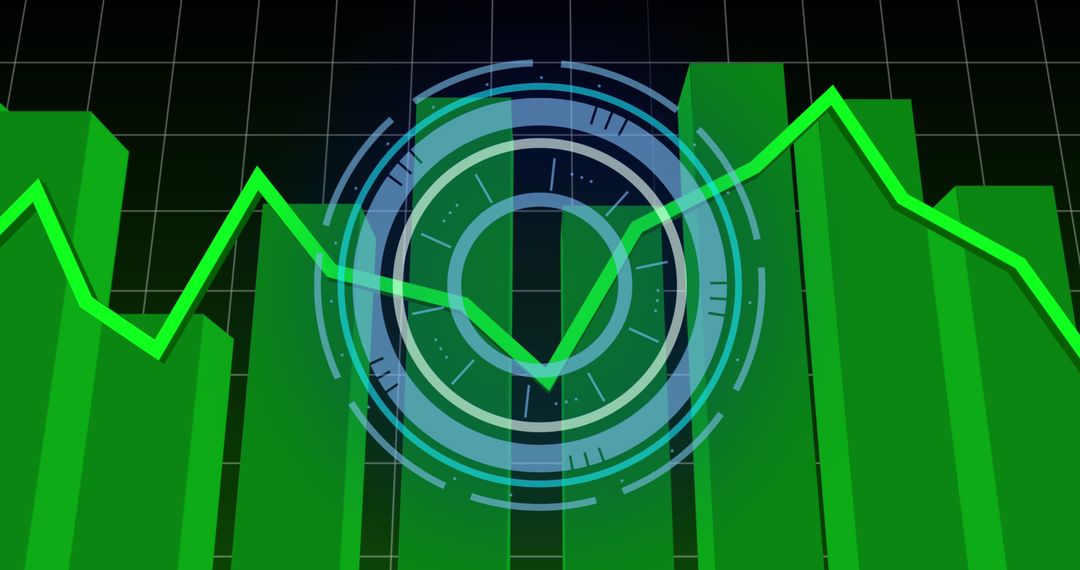
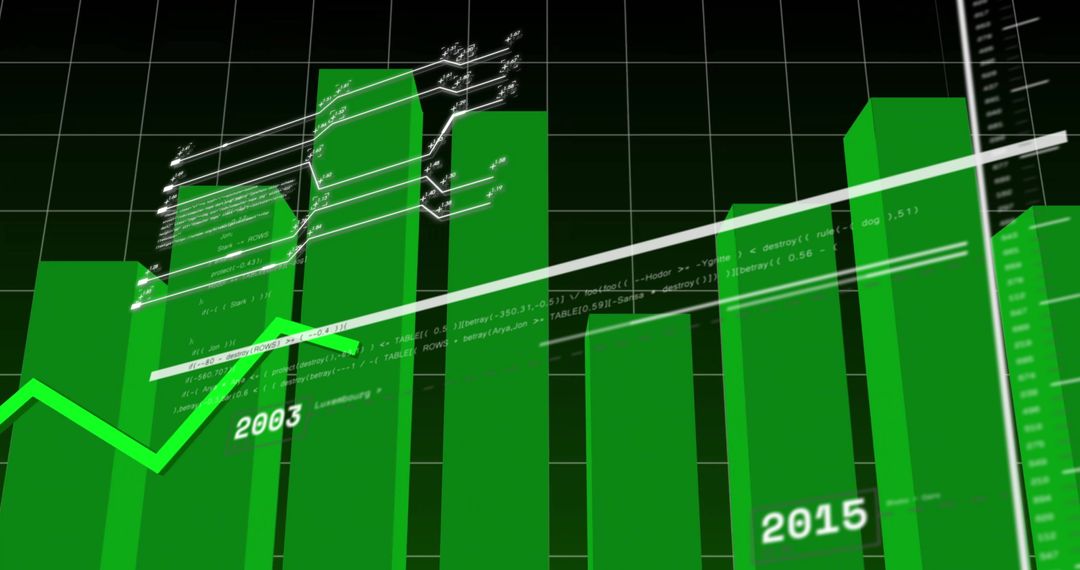
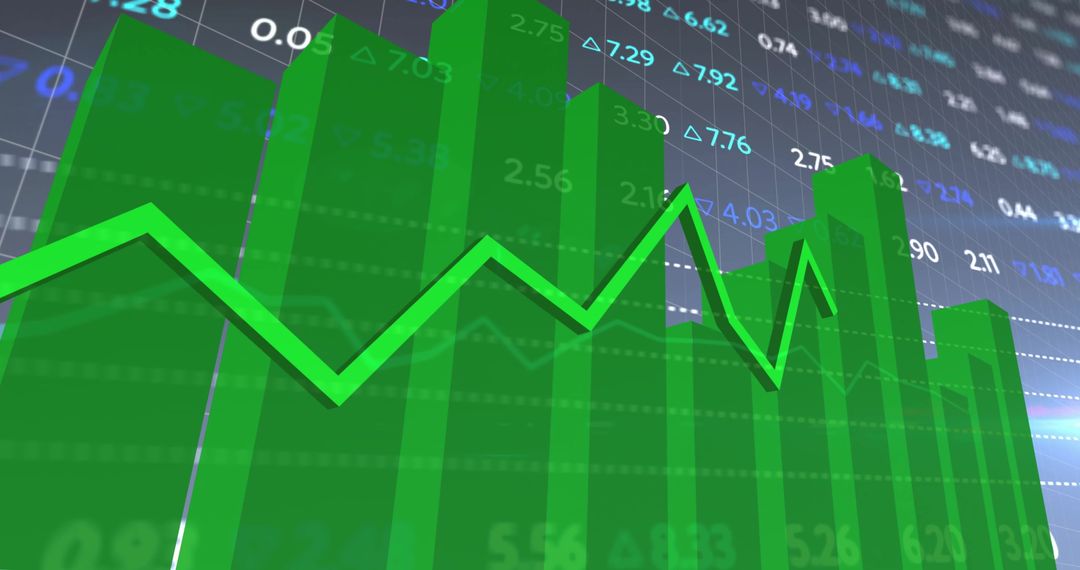
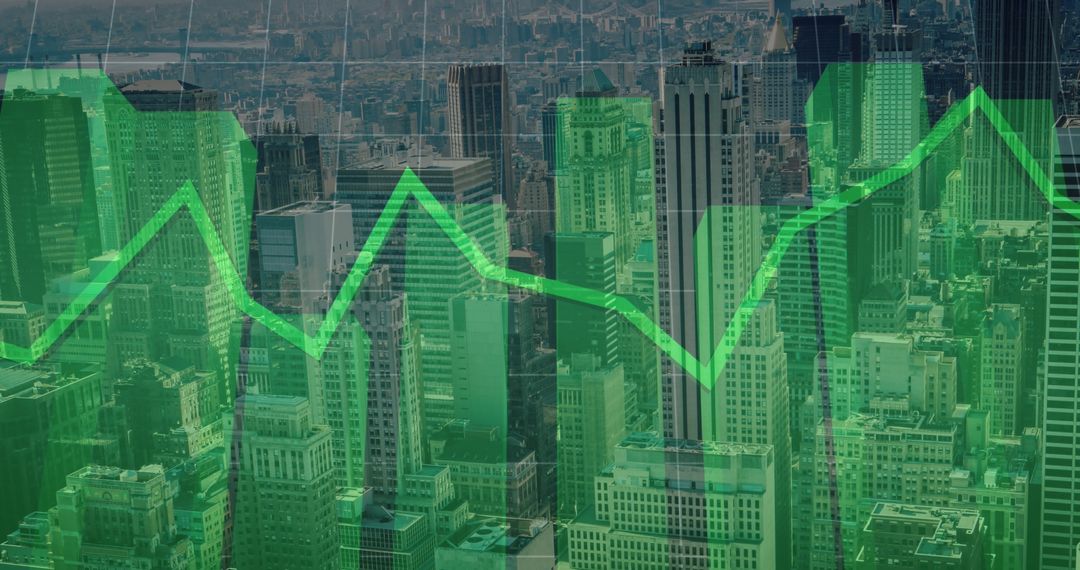
- Green Line Graph on Bar Chart Representing Financial Growth
Green Line Graph on Bar Chart Representing Financial Growth Image

Depicts a vivid green line graph overlaying green bars, symbolizing financial growth and market trends. Often used in presentations, reports, and articles that focus on economic data and business performance. Captures a sense of progress and analysis, useful in illustrating complex financial concepts engagingly.
Powered by 


2
downloads
downloads
Tags:
More
Credit Photo
If you would like to credit the Photo, here are some ways you can do so
Text Link
photo Link
<span class="text-link">
<span>
<a target="_blank" href=https://pikwizard.com/photo/green-line-graph-on-bar-chart-representing-financial-growth/4c6bba853b4ad6888d24200b0c91f1dd/>PikWizard</a>
</span>
</span>
<span class="image-link">
<span
style="margin: 0 0 20px 0; display: inline-block; vertical-align: middle; width: 100%;"
>
<a
target="_blank"
href="https://pikwizard.com/photo/green-line-graph-on-bar-chart-representing-financial-growth/4c6bba853b4ad6888d24200b0c91f1dd/"
style="text-decoration: none; font-size: 10px; margin: 0;"
>
<img src="https://pikwizard.com/pw/medium/4c6bba853b4ad6888d24200b0c91f1dd.jpg" style="margin: 0; width: 100%;" alt="" />
<p style="font-size: 12px; margin: 0;">PikWizard</p>
</a>
</span>
</span>
Free (free of charge)
Free for personal and commercial use.
Author: Authentic Images
Similar Free Stock Images

Premium


Premium


Premium


Premium


Premium


Premium


Premium


Premium


Premium


Premium


Premium


Premium


Premium


Premium


Premium


Premium


Premium


Premium


Premium


Premium


Premium


Premium


Premium


Premium