- Home >
- Stock Photos >
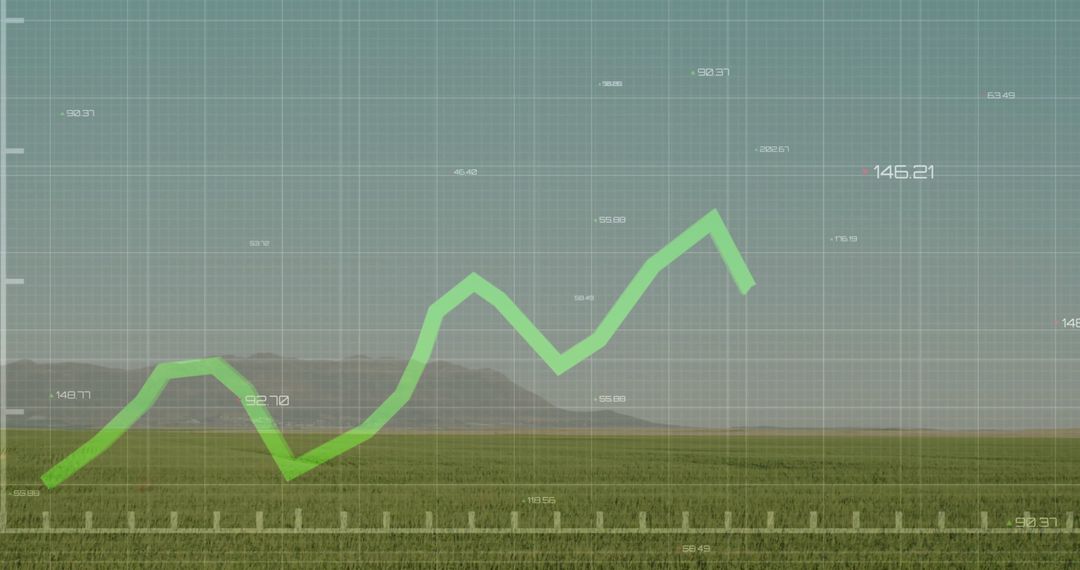
- Green Line Graph Overlaid on Empty Office with Data Overlay
Green Line Graph Overlaid on Empty Office with Data Overlay Image

A dynamic illustration featuring a prominent green graph line chart superimposed over a modern, empty office. The office is equipped with multiple monitors and workstations, symbolizing data processing and communication. The digital interface and figures give a sense of modern technology, business forecasting, and strategic finance importance. Ideal for use in financial presentations, economic forecasts, technology company marketing, and educational materials about data trends and digital workspace solutions.
Powered by  - Get 15% off with code: PIKWIZARD15


2
downloads
downloads
Tags:
More
Credit Photo
If you would like to credit the Photo, here are some ways you can do so
Text Link
photo Link
<span class="text-link">
<span>
<a target="_blank" href=https://pikwizard.com/photo/green-line-graph-overlaid-on-empty-office-with-data-overlay/445a804df39c959d4549273f804ff68d/>PikWizard</a>
</span>
</span>
<span class="image-link">
<span
style="margin: 0 0 20px 0; display: inline-block; vertical-align: middle; width: 100%;"
>
<a
target="_blank"
href="https://pikwizard.com/photo/green-line-graph-overlaid-on-empty-office-with-data-overlay/445a804df39c959d4549273f804ff68d/"
style="text-decoration: none; font-size: 10px; margin: 0;"
>
<img src="https://pikwizard.com/pw/medium/445a804df39c959d4549273f804ff68d.jpg" style="margin: 0; width: 100%;" alt="" />
<p style="font-size: 12px; margin: 0;">PikWizard</p>
</a>
</span>
</span>
Free (free of charge)
Free for personal and commercial use.
Author: Creative Art
Similar Free Stock Images

Premium