
- Home >
- Stock Photos >
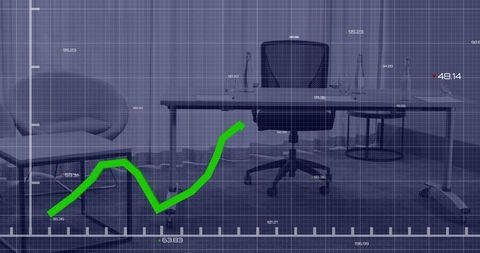
- Green Line Graph Showing Growth with Office Desk Background
Green Line Graph Showing Growth with Office Desk Background Image
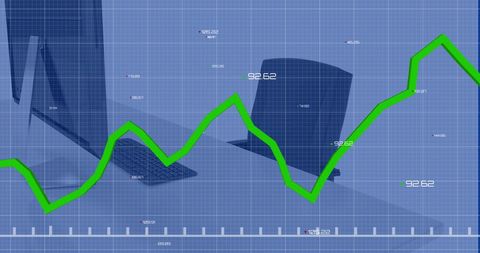
Dynamic green line graph representing financial growth overlaying office desk with laptop and empty chair emphasizes focus on business analytics and investment strategy. Ideal for use in business presentations, finance websites, and technology-focused marketing.
Powered by 


downloads
Tags:
More
Credit Photo
If you would like to credit the Photo, here are some ways you can do so
Text Link
photo Link
<span class="text-link">
<span>
<a target="_blank" href=https://pikwizard.com/photo/green-line-graph-showing-growth-with-office-desk-background/3de763ee6270cabcdaafd96428703e50/>PikWizard</a>
</span>
</span>
<span class="image-link">
<span
style="margin: 0 0 20px 0; display: inline-block; vertical-align: middle; width: 100%;"
>
<a
target="_blank"
href="https://pikwizard.com/photo/green-line-graph-showing-growth-with-office-desk-background/3de763ee6270cabcdaafd96428703e50/"
style="text-decoration: none; font-size: 10px; margin: 0;"
>
<img src="https://pikwizard.com/pw/medium/3de763ee6270cabcdaafd96428703e50.jpg" style="margin: 0; width: 100%;" alt="" />
<p style="font-size: 12px; margin: 0;">PikWizard</p>
</a>
</span>
</span>
Free (free of charge)
Free for personal and commercial use.
Author: People Creations
Similar Free Stock Images
Loading...

Premium


Premium


Premium


Premium


Premium


Premium


Premium


Premium


Premium


Premium


Premium


Premium

Premium


Premium

Premium


Premium


Premium


Premium


Premium


Premium


Premium


Premium


Premium


Premium

Premium


Explore More Free Stock Images