- Home >
- Stock Photos >
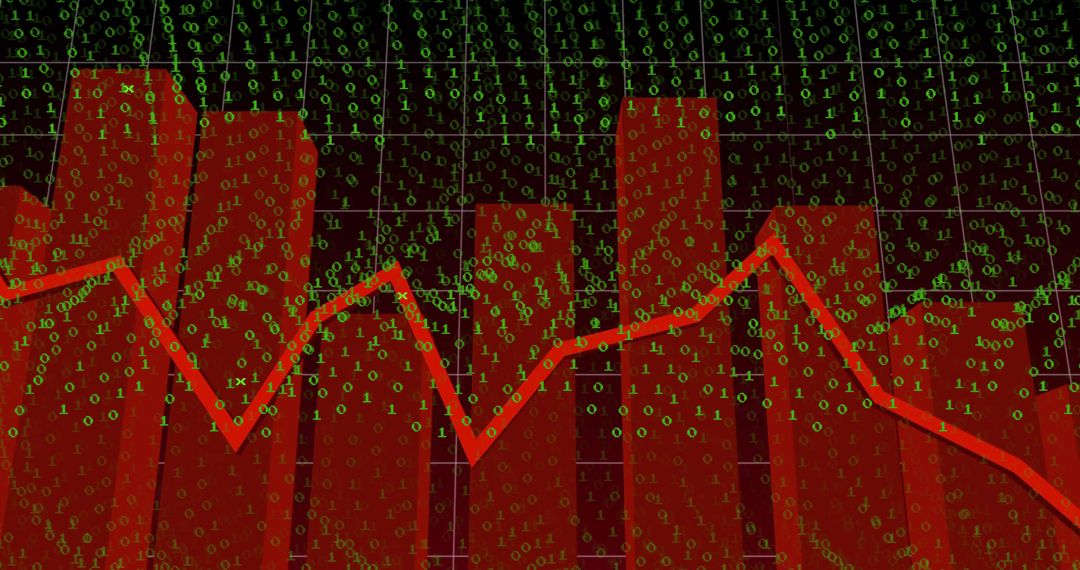
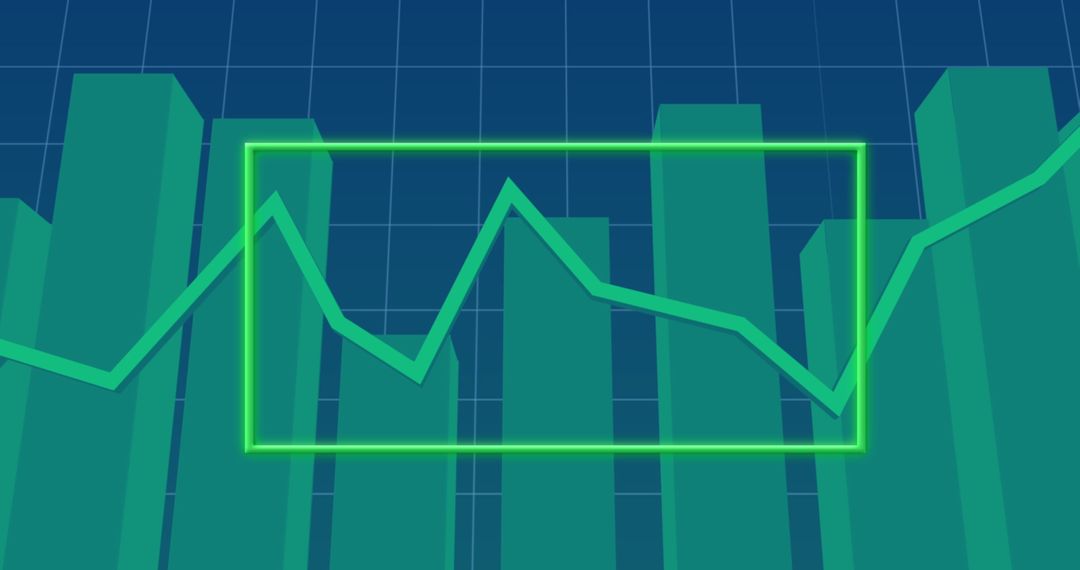
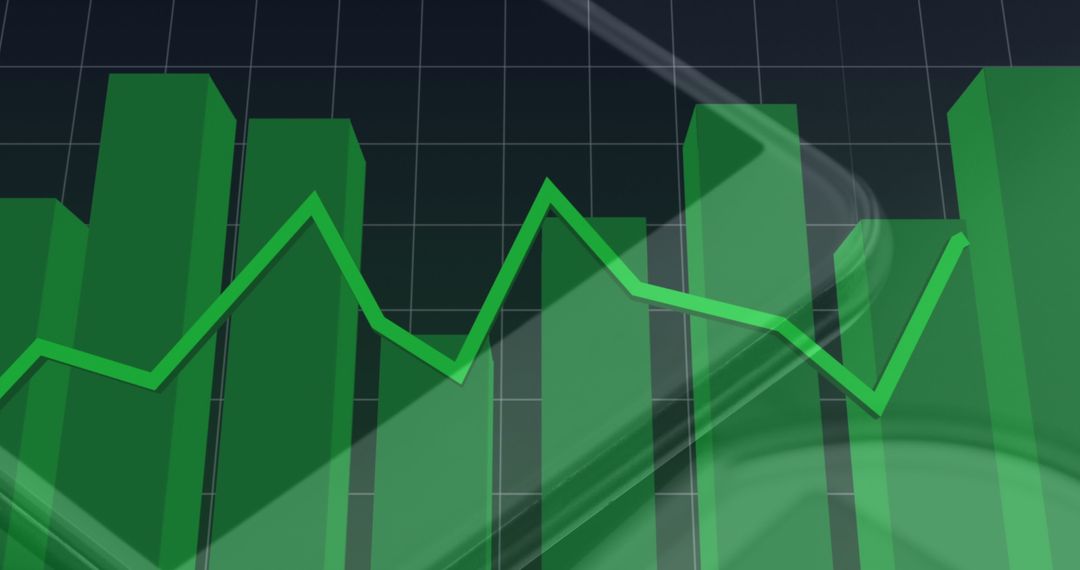
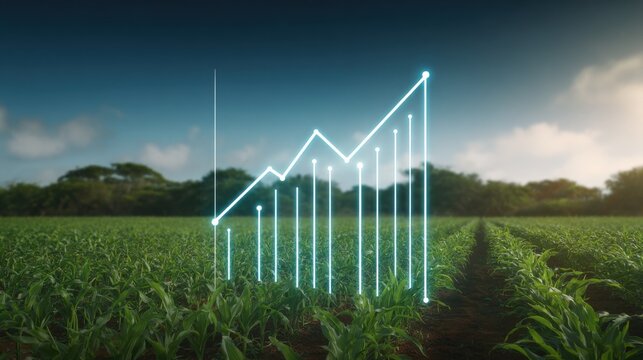
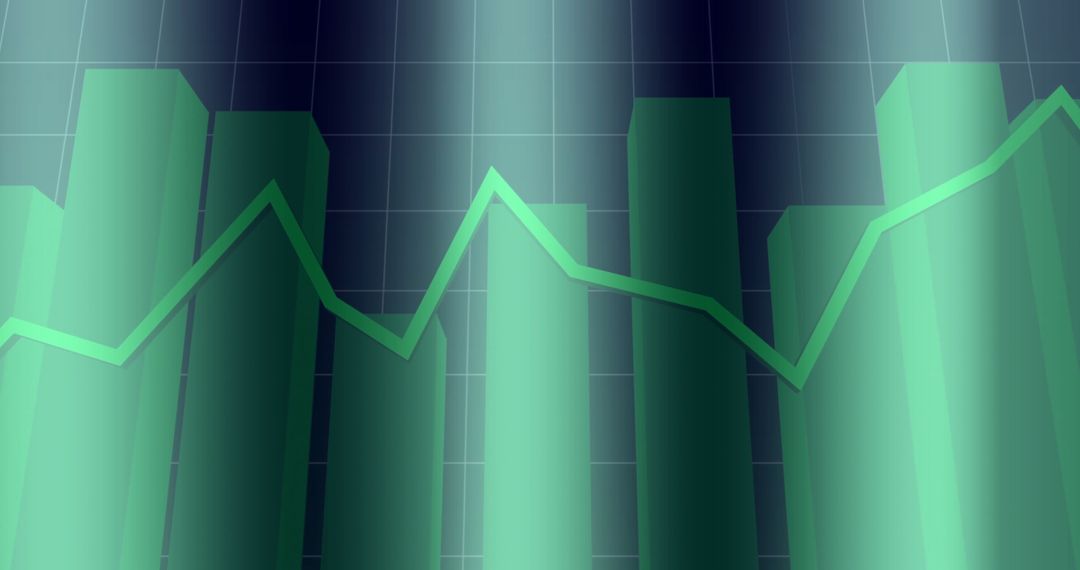
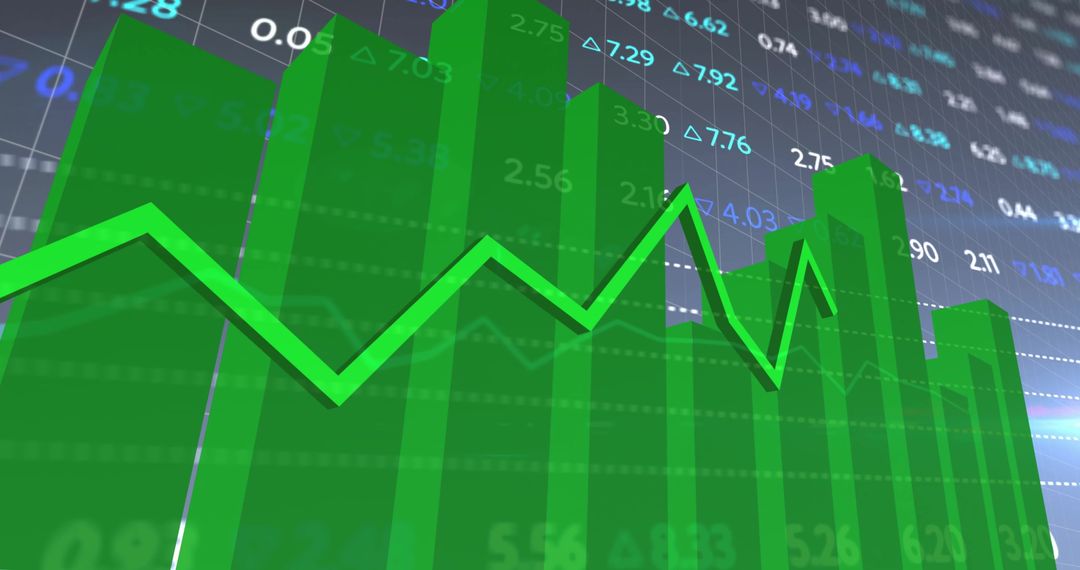
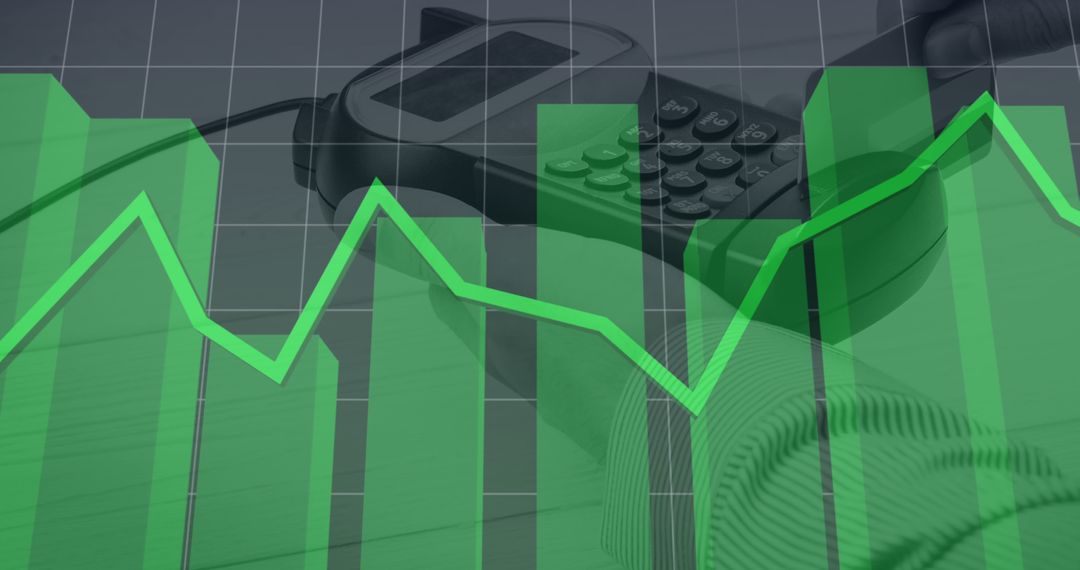
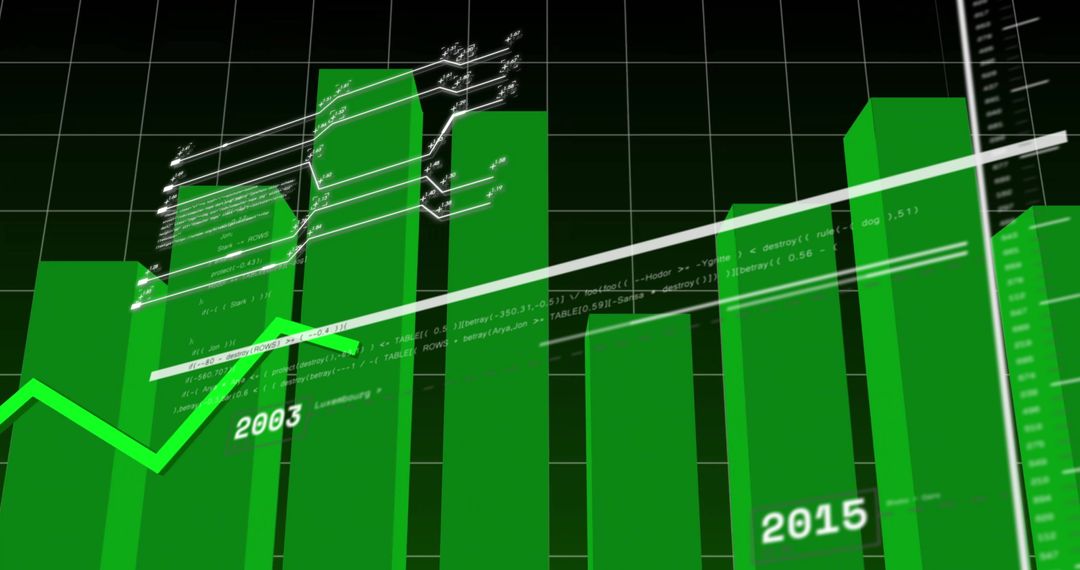
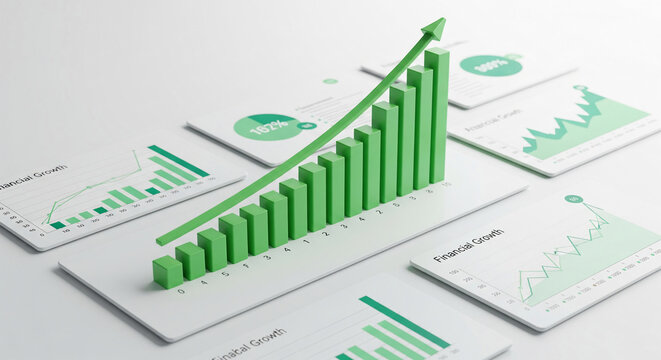
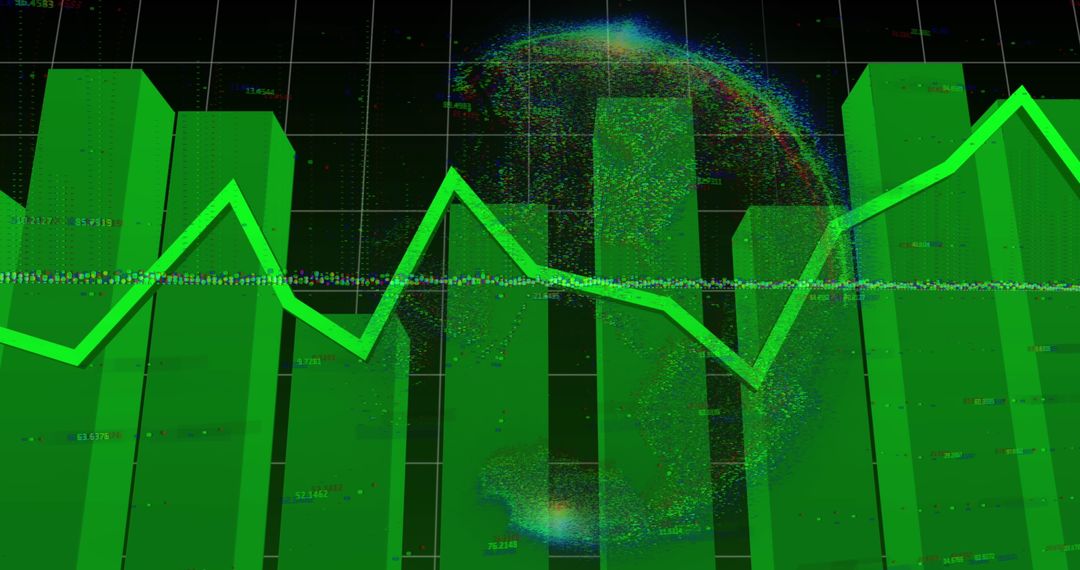
- Green Line Graph with Vertical Bars for Data Analysis
Green Line Graph with Vertical Bars for Data Analysis Image

Dynamic green line weaving through vertical bars represents fluctuations in data over time. Grid background indicates focus on statistics, data processing, or market trends. Ideal for illustrating finance, stock market insights, business reports, or educational content on analytics.
Powered by 


0
downloads
downloads
Tags:
More
Credit Photo
If you would like to credit the Photo, here are some ways you can do so
Text Link
photo Link
<span class="text-link">
<span>
<a target="_blank" href=https://pikwizard.com/photo/green-line-graph-with-vertical-bars-for-data-analysis/9458ab4b652629109b44b249603af758/>PikWizard</a>
</span>
</span>
<span class="image-link">
<span
style="margin: 0 0 20px 0; display: inline-block; vertical-align: middle; width: 100%;"
>
<a
target="_blank"
href="https://pikwizard.com/photo/green-line-graph-with-vertical-bars-for-data-analysis/9458ab4b652629109b44b249603af758/"
style="text-decoration: none; font-size: 10px; margin: 0;"
>
<img src="https://pikwizard.com/pw/medium/9458ab4b652629109b44b249603af758.jpg" style="margin: 0; width: 100%;" alt="" />
<p style="font-size: 12px; margin: 0;">PikWizard</p>
</a>
</span>
</span>
Free (free of charge)
Free for personal and commercial use.
Author: Creative Art
Similar Free Stock Images

Premium


Premium


Premium


Premium


Premium


Premium


Premium


Premium


Premium


Premium


Premium


Premium


Premium


Premium


Premium


Premium


Premium


Premium


Premium


Premium


Premium


Premium


Premium


Premium