
- Home >
- Stock Photos >
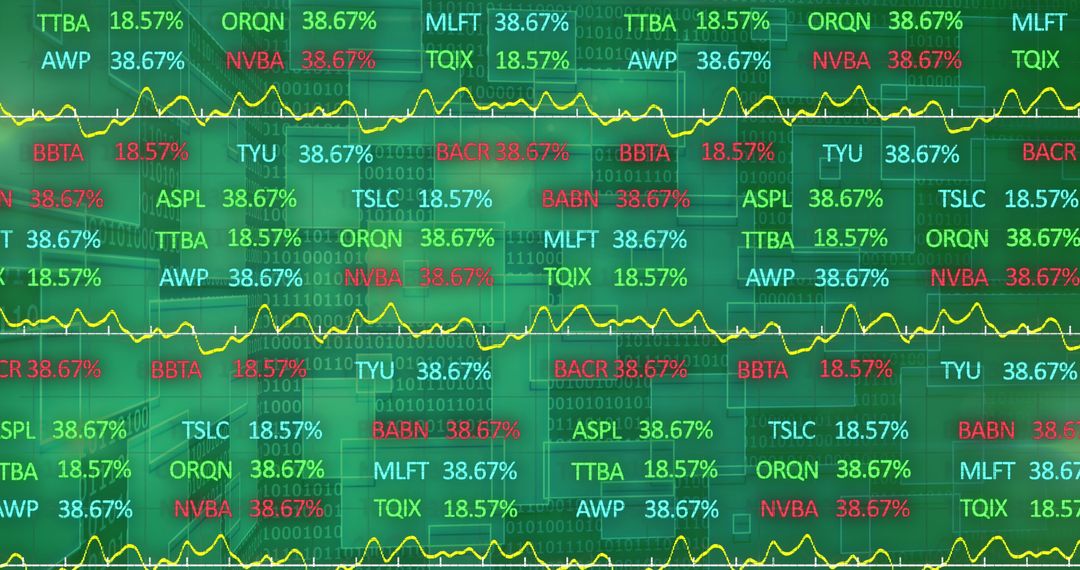
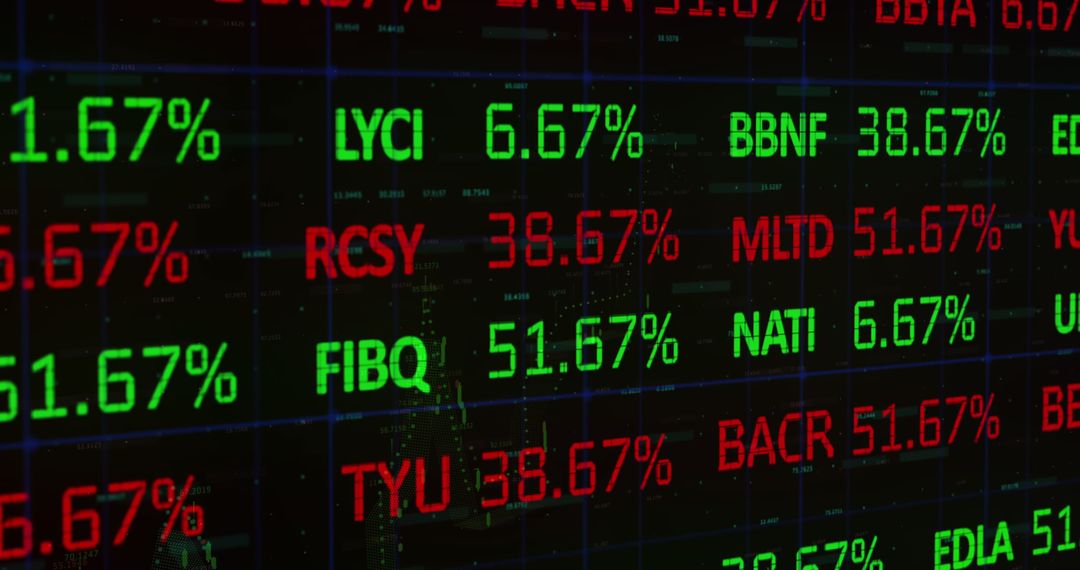
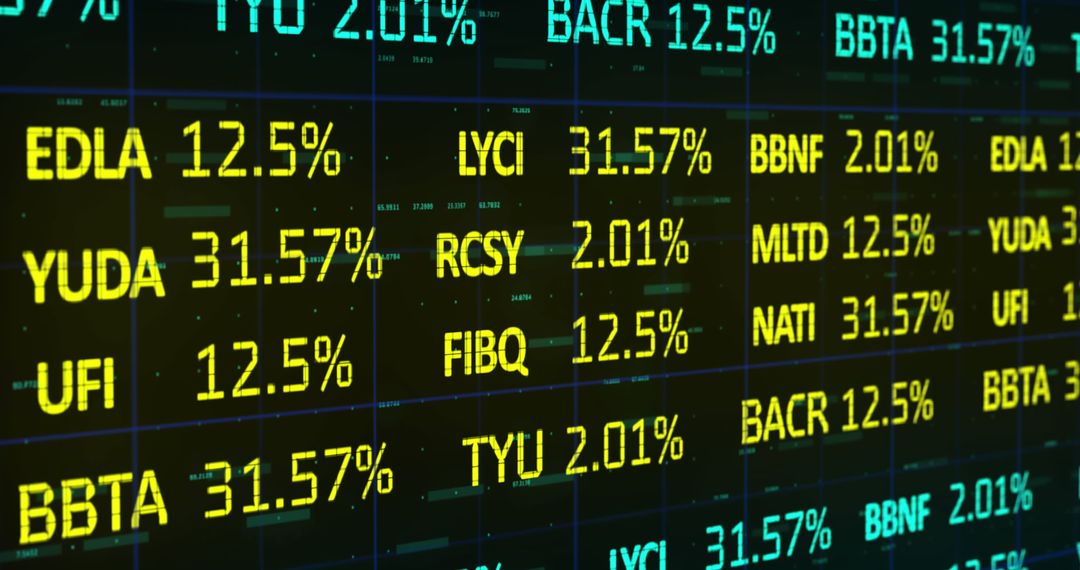
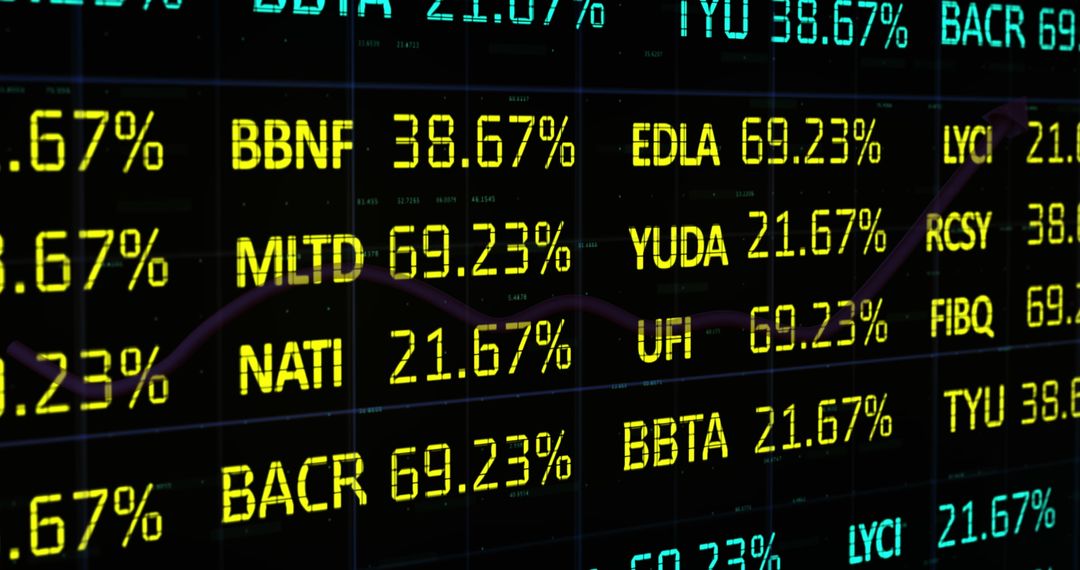
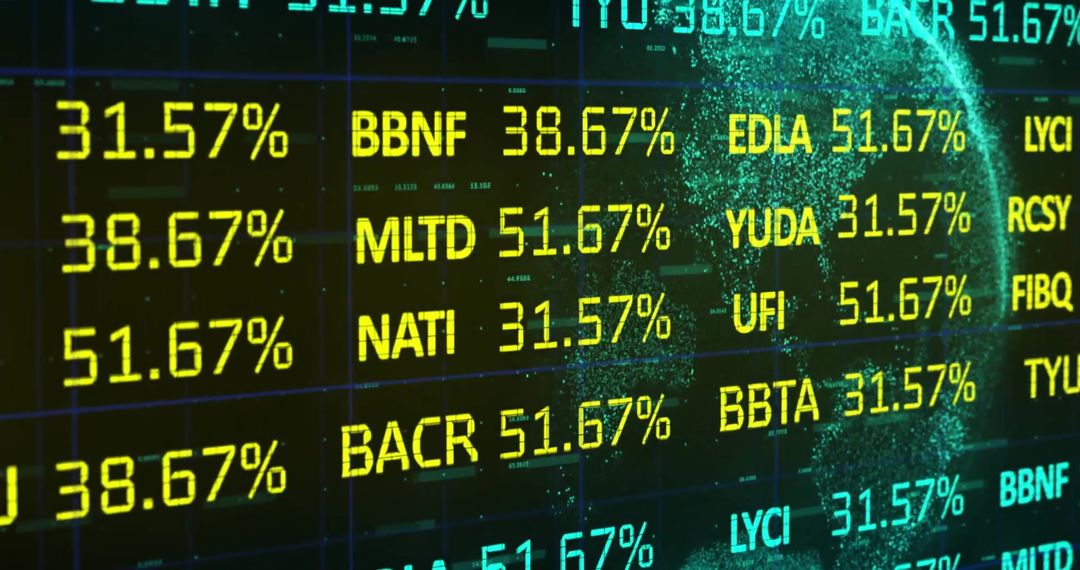
- Green Numbers and Graph Depicting Earning Projections on Electronic Display
Green Numbers and Graph Depicting Earning Projections on Electronic Display Image

Electronic stock display shows detailed financial numbers including high earnings percentages and graphical line projecting trends in green hue. Ideal for illustrating themes around stock market fluctuations, investment opportunities, and financial projections. Useful for presentations, articles, or websites focusing on finance, economic predictions, or business analytics.
Powered by  - Get 15% off with code: PIKWIZARD15


2
downloads
downloads
Tags:
More
Credit Photo
If you would like to credit the Photo, here are some ways you can do so
Text Link
photo Link
<span class="text-link">
<span>
<a target="_blank" href=https://pikwizard.com/photo/green-numbers-and-graph-depicting-earning-projections-on-electronic-display/311e3026a7dbd633c1cc19f61ddde37d/>PikWizard</a>
</span>
</span>
<span class="image-link">
<span
style="margin: 0 0 20px 0; display: inline-block; vertical-align: middle; width: 100%;"
>
<a
target="_blank"
href="https://pikwizard.com/photo/green-numbers-and-graph-depicting-earning-projections-on-electronic-display/311e3026a7dbd633c1cc19f61ddde37d/"
style="text-decoration: none; font-size: 10px; margin: 0;"
>
<img src="https://pikwizard.com/pw/medium/311e3026a7dbd633c1cc19f61ddde37d.jpg" style="margin: 0; width: 100%;" alt="" />
<p style="font-size: 12px; margin: 0;">PikWizard</p>
</a>
</span>
</span>
Free (free of charge)
Free for personal and commercial use.
Author: Authentic Images
Similar Free Stock Images

Premium


Premium


Premium


Premium


Premium


Premium


Premium


Premium


Premium


Premium


Premium


Premium


Premium


Premium


Premium


Premium


Premium


Premium


Premium


Premium


Premium


Premium


Premium


Premium

