- Home >
- Stock Photos >
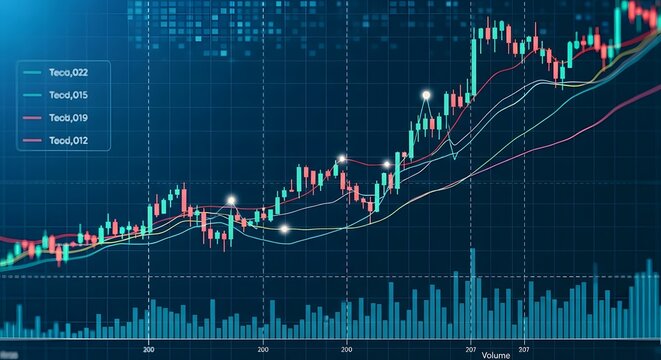
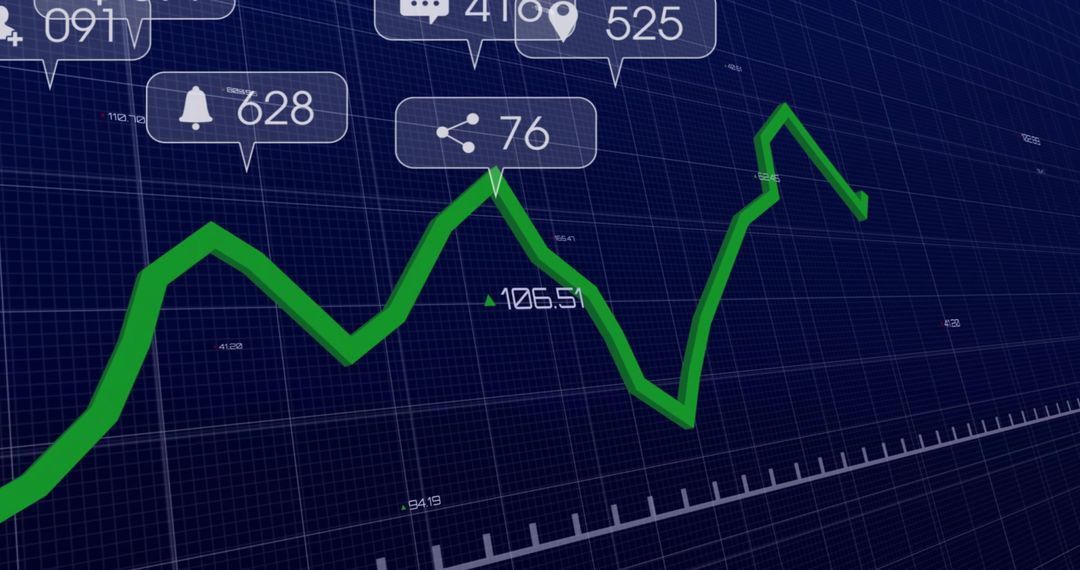
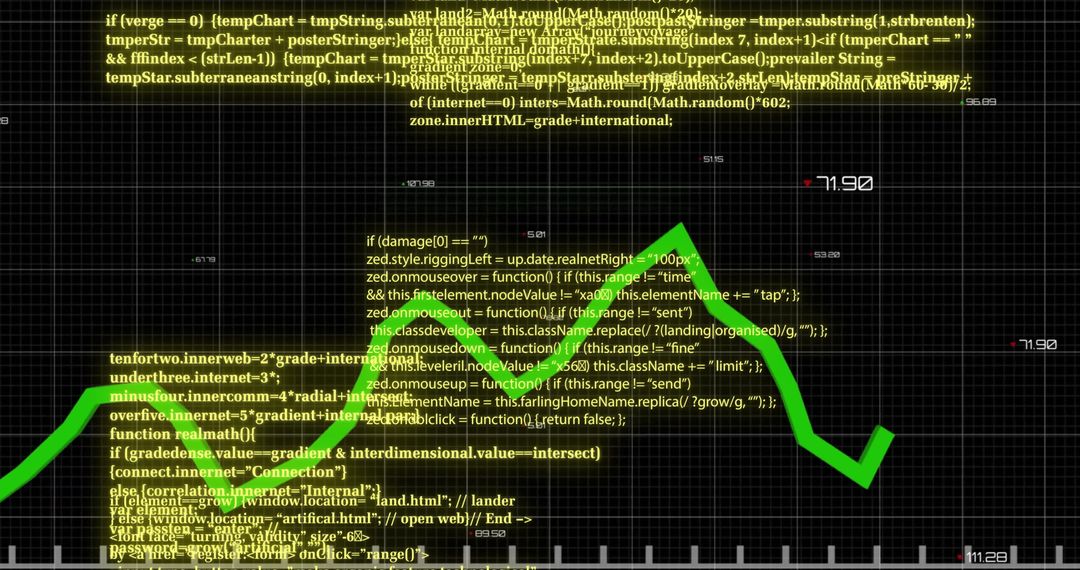
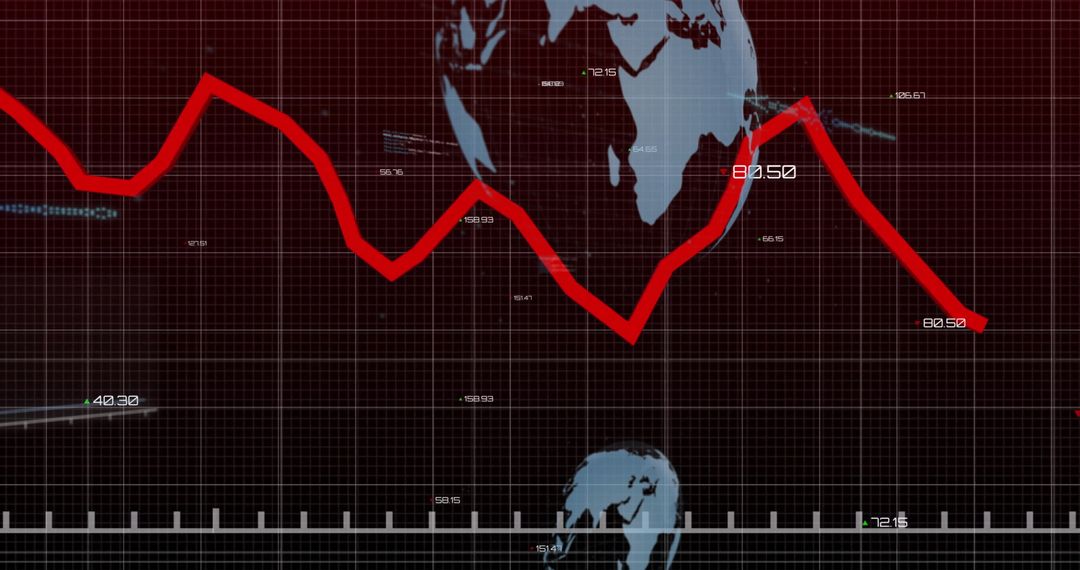
- Green Uptrend Line Chart Showing Market Recovery, Financial Analytics, Data Visualization
Green Uptrend Line Chart Showing Market Recovery, Financial Analytics, Data Visualization Image

Displaying green zigzag line climbing across dark blue grid with axis ticks and globe silhouette. Conveying financial uptrend, market recovery, positive trading momentum. Suitable for business presentations, investor reports, trading dashboards, and marketing materials. Pairing with headlines about market growth, earnings recovery, trading strategies, economic outlook, or portfolio performance. Offering space for overlaying headline text, brand logo, or data labels. Working well for website banners, social media posts, pitch decks, annual reports, and financial news. Providing modern HUD aesthetic for fintech brands, analytics teams, and corporate communications.
Powered by 


0
downloads
downloads
Tags:
More
Credit Photo
If you would like to credit the Photo, here are some ways you can do so
Text Link
photo Link
<span class="text-link">
<span>
<a target="_blank" href=https://pikwizard.com/photo/green-uptrend-line-chart-showing-market-recovery-financial-analytics-data-visualization/dd693e4585aeb0e8c9c54316e4d2ae1c/>PikWizard</a>
</span>
</span>
<span class="image-link">
<span
style="margin: 0 0 20px 0; display: inline-block; vertical-align: middle; width: 100%;"
>
<a
target="_blank"
href="https://pikwizard.com/photo/green-uptrend-line-chart-showing-market-recovery-financial-analytics-data-visualization/dd693e4585aeb0e8c9c54316e4d2ae1c/"
style="text-decoration: none; font-size: 10px; margin: 0;"
>
<img src="https://pikwizard.com/pw/medium/dd693e4585aeb0e8c9c54316e4d2ae1c.jpg" style="margin: 0; width: 100%;" alt="" />
<p style="font-size: 12px; margin: 0;">PikWizard</p>
</a>
</span>
</span>
Free (free of charge)
Free for personal and commercial use.
Author: Creative Art
Similar Free Stock Images

Premium


Premium


Premium


Premium


Premium


Premium


Premium


Premium


Premium


Premium


Premium


Premium


Premium


Premium


Premium


Premium


Premium


Premium


Premium


Premium


Premium


Premium


Premium


Premium