
- Home >
- Stock Photos >
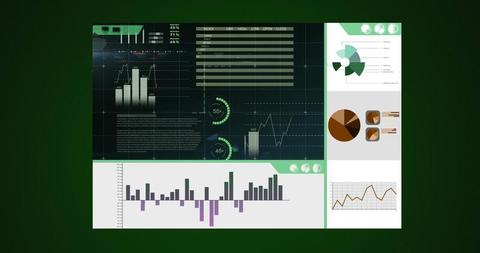
- Growing Data Trends on Gradient Background
Growing Data Trends on Gradient Background Image

Dynamic visualization of data growth displayed on gradient background suitable for illustrating articles or presentations in business, technology, or digital transformation contexts. Ideal for use in infographics, reports, and websites focused on data analytics or statistics.
Powered by  - Get 15% off with code: PIKWIZARD15


downloads
Tags:
More
Credit Photo
If you would like to credit the Photo, here are some ways you can do so
Text Link
photo Link
<span class="text-link">
<span>
<a target="_blank" href=https://pikwizard.com/photo/growing-data-trends-on-gradient-background/da3376fe0b14e82b2aece55f1f9a7d0d/>PikWizard</a>
</span>
</span>
<span class="image-link">
<span
style="margin: 0 0 20px 0; display: inline-block; vertical-align: middle; width: 100%;"
>
<a
target="_blank"
href="https://pikwizard.com/photo/growing-data-trends-on-gradient-background/da3376fe0b14e82b2aece55f1f9a7d0d/"
style="text-decoration: none; font-size: 10px; margin: 0;"
>
<img src="https://pikwizard.com/pw/medium/da3376fe0b14e82b2aece55f1f9a7d0d.jpg" style="margin: 0; width: 100%;" alt="" />
<p style="font-size: 12px; margin: 0;">PikWizard</p>
</a>
</span>
</span>
Free (free of charge)
Free for personal and commercial use.
Author: People Creations
Similar Free Stock Images

Premium


Premium


Premium

Premium


Premium


Premium


Premium


Premium

Premium


Premium


Premium


Premium


Premium


Premium


Premium


Premium


Premium


Premium


Premium

Premium


Premium

Premium

Premium

Premium


Premium


Explore More Free Stock Images