1. Home > 
  2. Stock Photos > 
  3. Growing Graph and Servers Representing Data Growth and Analysis

Growing Graph and Servers Representing Data Growth and Analysis Image

Growing Graph and Servers Representing Data Growth and Analysis

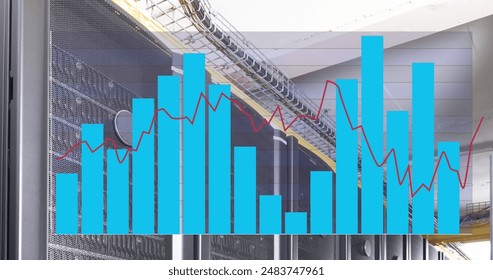
This image illustrates a growing graph merged with a backdrop of server racks, signifying analysis and big data growth in technology sectors. Perfect for use in business presentations, tech blogs, and articles focusing on data security, business analytics, and networking advancements.

Powered by Shutterstock logo - Get 15% off with code: PIKWIZARD15
Team of Professional IT Developers Have a Meeting, Speaker Shows Growth Data with Graphs, Charts, Software UI. Shown on TV. Concept: Software UI Development, Deep Learning, Graphs, Charts. - Powered by Shutterstock - Get 15% off with code: PIKWIZARD15Displaying server cabinets featuring binary code glass panels in data center aisle, with eco icons. Technology, infrastructure, innovation, digital, sustainability, energy efficiency, industrial - Powered by Shutterstock - Get 15% off with code: PIKWIZARD15Showing server racks glowing blue in data center hallway with cable trays, featuring green icons. Technology, digital, futuristic, infrastructure, innovation, energy, efficiency - Powered by Shutterstock - Get 15% off with code: PIKWIZARD15Showcasing three server cabinets with glowing blue LED lights, eco icons and code in data center. Technology, sustainability, data infrastructure, digital innovation, eco-friendly, smart systems, - Powered by Shutterstock - Get 15% off with code: PIKWIZARD15Image of arrows over connected dots on data server racks in server room. Digital composite, multiple exposure, direction, growth, communication, data center, networking and technology concept. - Powered by Shutterstock - Get 15% off with code: PIKWIZARD15

Credit Photo

If you would like to credit the Photo, here are some ways you can do so

Free (free of charge)

Free for personal and commercial use.

Author: People Creations

Similar Free Stock Images

Loading...
COVID-19 Virus Visualization with Digital Data and Graphs
Premium
Image of multiple icons, graphs with changing numbers over data server racks. Digital composite, report, business, growth, education, data center, networking, technology, network server concept.
Digital Interface Data with Virus Influence Overlaid on Server Room
Premium
Image of graphs against server racks in server room. Digital composite, multiple exposure, report, network security, data center, networking, technology and network server concept.
Premium
Image of graph and changing numbers over data server racks in server room. Digital composite, multiple exposure, report, business, growth, data center, networking and technology concept.
Red Arrow with Financial Decline in Urban Setting Overlay
Futuristic Financial Growth Chart Over Urban Nightscape
Rising Global Data Trends Over Planet Earth
Abstract Digital Data Chart with Arrow Network
3D Rendered Red Bar Graph with Data Visual Elements
Global Business Trends and Data Analysis
Digital Infographic with Numerical Data and Graph
Futuristic Financial Data Chart with Global Digital Network
Declining Graph Overlay on Empty Conference Room
Rising Business Graph and Data Analytics in Modern Office
Rising Statistical Data in Stormy Digital Environment
Rising Financial Data Visual Over Earth
Business Team Collaborating with Financial Data Visualization
Rising Bar Graph on Globe with Global Data Art
Global Economic Data Trends with Rotating Earth and Graphs
Dynamic Financial Data Visualized Over Warehouse Background
Rising Chart Overlay on Stormy Skies Symbolizing Turbulent Growth
Rising Financial Graph with Digital Data Overlay
Rising Global Stock Market Trends Over Digital Globe Projection
Dynamic Data Growth Chart with Digital Interface and Arrow
Futuristic Magenta Bar Chart with Rising Trend Line
Coronavirus Data Analysis with Red Charts on Blue Background
Covid-19 Pandemic Data Analysis with Rising Graphs
Digital Interface with Financial Data Overlaid on Server Room
Digital Graphs and Pandemic Impact Over Data Center
Futuristic Red Data Visualization with Bar Chart and Arrow
Increasing Bar Chart with Arrow on Green Grid Background
Premium
Image of multiple graphs with changing numbers over data server room. Digital composite, multiple exposure, report, business, growth, data center, networking and technology concept.
Premium
Person Presenting Software Update Progress in 2024-2025
Economic Data Analysis Overlaid on Nepali Flag
Abstract Financial Data Chart with Blue Background
Financial Analysis with Technology Overlay in Business Office
Social Media Engagement Icons Overlaying Data Graph
Rising Profits Concept with Bar Graph in Conference Room
Digital Growth Bar Graph in Empty Conference Room
Red Bar Graph with Upward Arrow Overlay on Cityscape Background
Digital Data Growth with Futuristic Digital Display
Asian Woman Exercising with Financial Growth Overlay
Growth Chart with Globe and Space Background
Rising Bar Graph with Globe in Digital Business Concept
Rising Bar Graph Against Dramatic Stormy Sky
Modern Data Center with Digital Analytics Overlay
Data Processing and Digital Analytics Over Modern Server Room
Dynamic Financial Graph with Data Analytics Overlaid on Dark Background
Upward Financial Growth Represented Through Bar Graph in Cloudy Sky
Digital Financial Data Overlay on Server Room Background
Abstract 3D Bars in Digital Virtual Space with Azure Nodes
COVID-19 Data Analysis with Graphs and Viral Corona Cells
Rising Graph and COVID-19 Cells on Digital Background
Premium
Image of line graph showing growth over asian male engineer with laptop checking server racks. Digital composite, networking, data center, technology, business, report and security concept.
Digital Interface With Graphs in Data Center Overlayed by Virus Concept
Global Finance Analytics with Rising and Falling Charts
Rising Bar Graph with Red Arrows on Digital Background
Growing Bar Chart with Data Analytics on Cloud Background
Dynamic Data Representation with Digital Rain Effect Visualization
Financial Growth Charts Overlaying Urban Cityscape By Day
Digital Financial Data Graph Display Over Global Network
Global Financial Data Processing with Chart Overlay
Abstract Financial Technology with Digital Growth Charts
Digital Interface with Growing Financial Chart and Global Data
Digital Bar Graph Displaying Financial Growth in Office Setting
Dynamic Business Growth Concept with Red Bar Graph Overlay
Global Networking and Statistical Data Visualization
Descending Arrow Icons with Colored Bar Graphs on Black Background
Innovative Data Visualization Overlaying Digital Head Model
Animated Bar Graphs and Globe Highlighting Financial Loss and Globalization
Rising Profits Illustrated by Bar Graph and Global Hologram
Global Finance and Data Visualization with Map and Bar Graphs
Digital Data Visualization Over Stormy Background
Rising Bar Chart in Digital Matrix Background Art
Futuristic Financial Data Graph with Forward Arrow
Data Visualization Overlay on Dark Stormy Background
Digital Data Analysis with Graph and Code Background
Futuristic 3D Financial Dashboard Displaying Gradient Bar Chart with Trajectory Arrow
Coronavirus Pandemic Impact with Declining Graph and Virus Cells
Digital Graph and Coronavirus Cells Overlay in Modern Server Room
Digital Interface Overlay with Coronavirus on Server Background
Digital Interface Displaying Virus Graphs in Server Room
Financial Growth Chart Overlaying Data Center
Retro Arcade Style Level Up Text Against Grid Background
Graphical Data Analysis Under Dramatic Stormy Skies
Rising Graph over Cityscape Symbolizing Global Business Growth
Businessman Analyzing Financial Growth on Smartphone with Digital Graph Overlay
Chinese Economy Growth with Cityscape and Data Overlays
Digital Data Graph with Futuristic Interface Elements
Global Data Analysis Over World Map with Digital Interface
Rising Financial Graph with Digital Data Interface
Graph Illustrating Inflation and Recession Impact in Office Setting
Office Bar Graph Indicating Economic Downturn Over Meeting Room
Data Processing and Analysis Over City Skyline
Composite Digital Growth Chart Over Server Infrastructure
Financial Data Chart in High-Tech Server Room Environment
Growing Bar Graph with Rising Arrow Against Rotating Globe
Infographic Bar Graph with Rising Arrow on Rotating Globe
Rising Bar Graph in Digital Financial Data Space
Businessman Analysing Financial Growth Overlaid with Data Graph
Rising Bar Graph with User Connections for Business Growth Concept
Abstract Financial Data Analysis with Bar and Line Graphs
Futuristic Data Analysis with Bar and Line Charts
Digital Graphs and Financial Data on Screen
Rising Bar Chart Overlay in Industrial Machining Environment