- Home >
- Stock Photos >
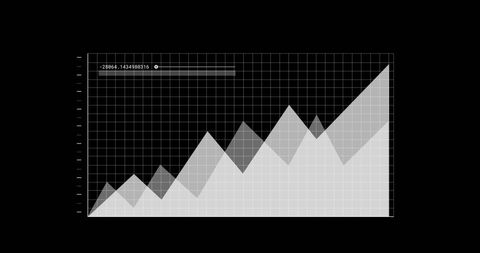
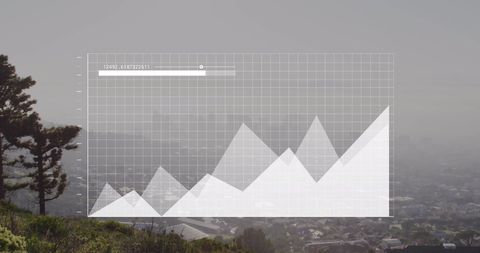
- Growing Graph in Modern Office Environment
Growing Graph in Modern Office Environment Image

This image shows a line graph represented over an office background, conveying themes of business growth, data analysis, and success in a corporate environment. The stylized digital elements reflect technology and digitization. This visual can be ideal for presentations, reports, or articles emphasizing business development, financial growth, or economic forecasting.
Powered by  - Get 15% off with code: PIKWIZARD15


downloads
Tags:
More
Credit Photo
If you would like to credit the Photo, here are some ways you can do so
Text Link
photo Link
<span class="text-link">
<span>
<a target="_blank" href=https://pikwizard.com/photo/growing-graph-in-modern-office-environment/237d51133ff8e902821707706659ca11/>PikWizard</a>
</span>
</span>
<span class="image-link">
<span
style="margin: 0 0 20px 0; display: inline-block; vertical-align: middle; width: 100%;"
>
<a
target="_blank"
href="https://pikwizard.com/photo/growing-graph-in-modern-office-environment/237d51133ff8e902821707706659ca11/"
style="text-decoration: none; font-size: 10px; margin: 0;"
>
<img src="https://pikwizard.com/pw/medium/237d51133ff8e902821707706659ca11.jpg" style="margin: 0; width: 100%;" alt="" />
<p style="font-size: 12px; margin: 0;">PikWizard</p>
</a>
</span>
</span>
Free (free of charge)
Free for personal and commercial use.
Author: Authentic Images
Similar Free Stock Images
Loading...

Premium


Premium

Premium


Premium


Premium


Premium

Premium


Premium

Premium


Premium


Premium

Premium

Premium


Premium

Premium

Premium


Premium

Premium

Premium


Premium

Premium

Premium

Premium


Premium


Premium