- Home >
- Stock Photos >
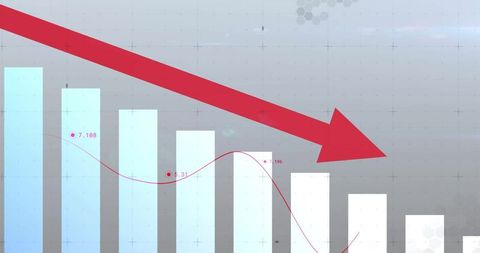
- Growing Line and Bar Graph over World Map Concept
Growing Line and Bar Graph over World Map Concept Image

Visualizing financial or market growth with line and bar graph contrasting world map. Perfect for presentations on global business, market analysis, investment growth, and digital assets. Suitable for illustrating data-driven decisions in technology and business blogs.

downloads
Tags:
More
Credit Photo
If you would like to credit the Photo, here are some ways you can do so
Text Link
photo Link
<span class="text-link">
<span>
<a target="_blank" href=https://pikwizard.com/photo/growing-line-and-bar-graph-over-world-map-concept/fdfa290eeb9725f6209ebc8100428fee/>PikWizard</a>
</span>
</span>
<span class="image-link">
<span
style="margin: 0 0 20px 0; display: inline-block; vertical-align: middle; width: 100%;"
>
<a
target="_blank"
href="https://pikwizard.com/photo/growing-line-and-bar-graph-over-world-map-concept/fdfa290eeb9725f6209ebc8100428fee/"
style="text-decoration: none; font-size: 10px; margin: 0;"
>
<img src="https://pikwizard.com/pw/medium/fdfa290eeb9725f6209ebc8100428fee.jpg" style="margin: 0; width: 100%;" alt="" />
<p style="font-size: 12px; margin: 0;">PikWizard</p>
</a>
</span>
</span>
Free (free of charge)
Free for personal and commercial use.
Author: Creative Art