- Home >
- Stock Photos >
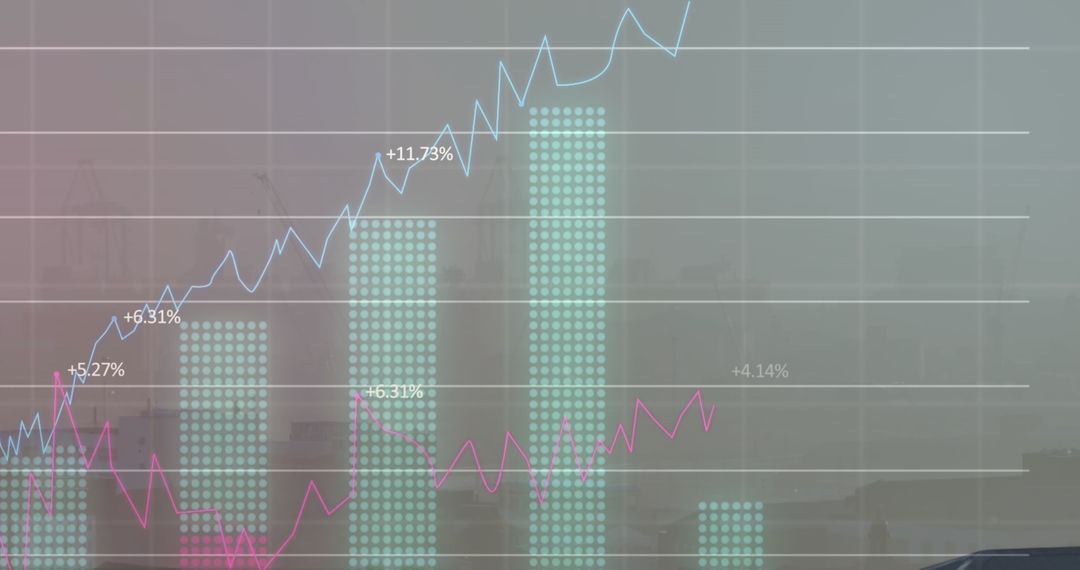
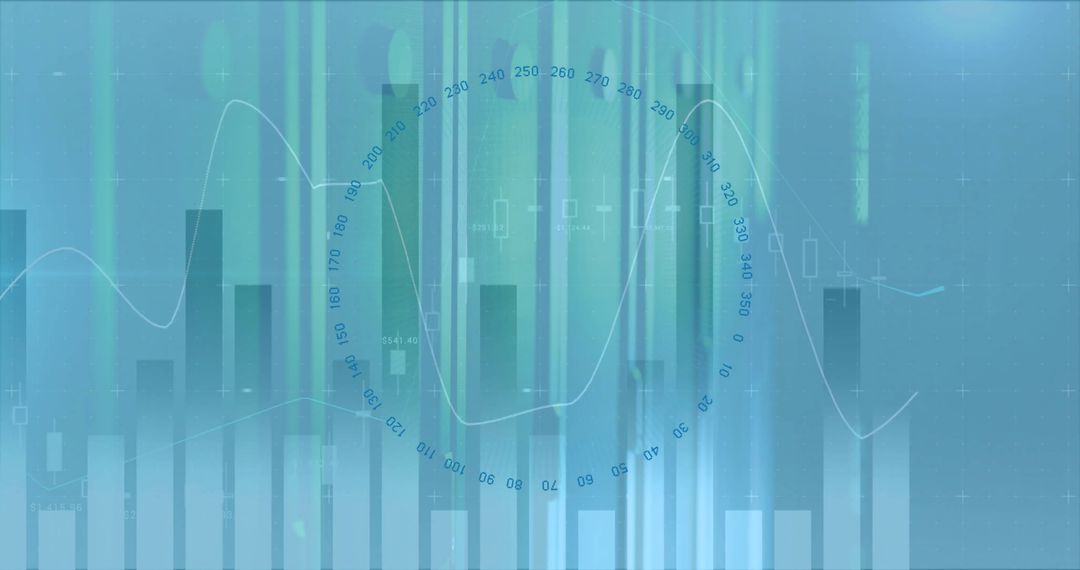
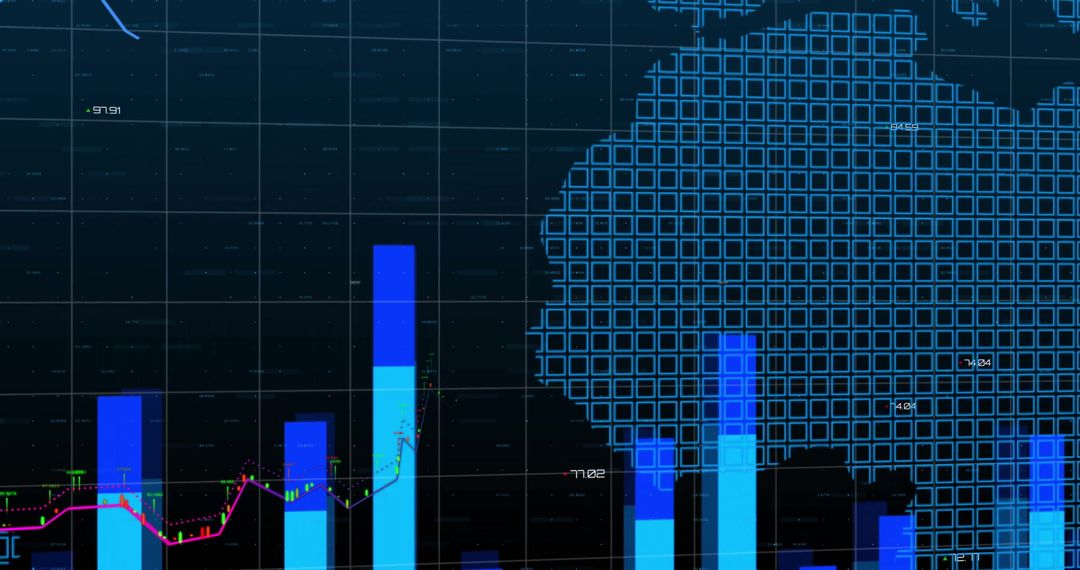
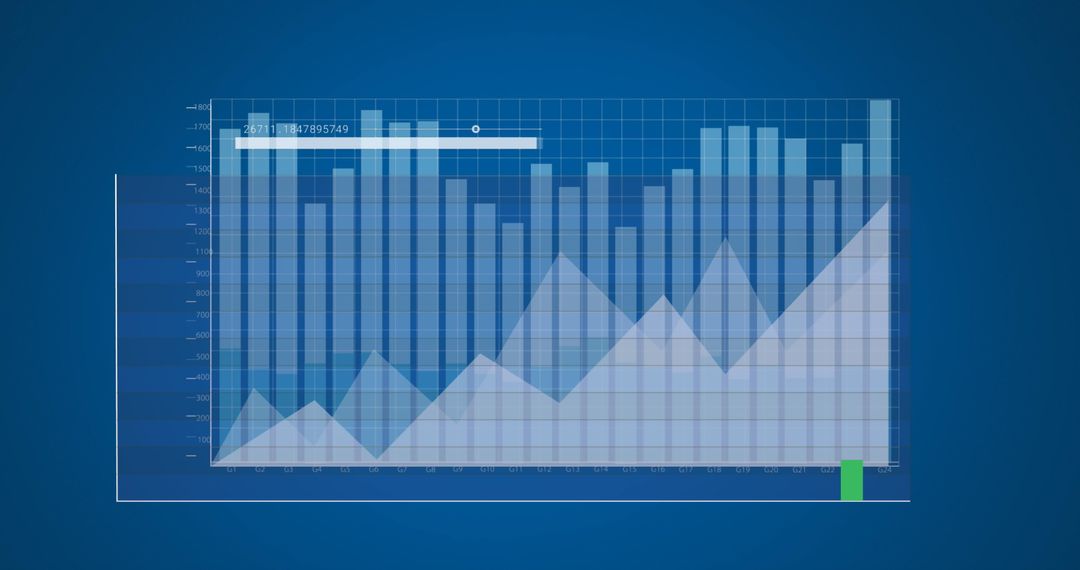
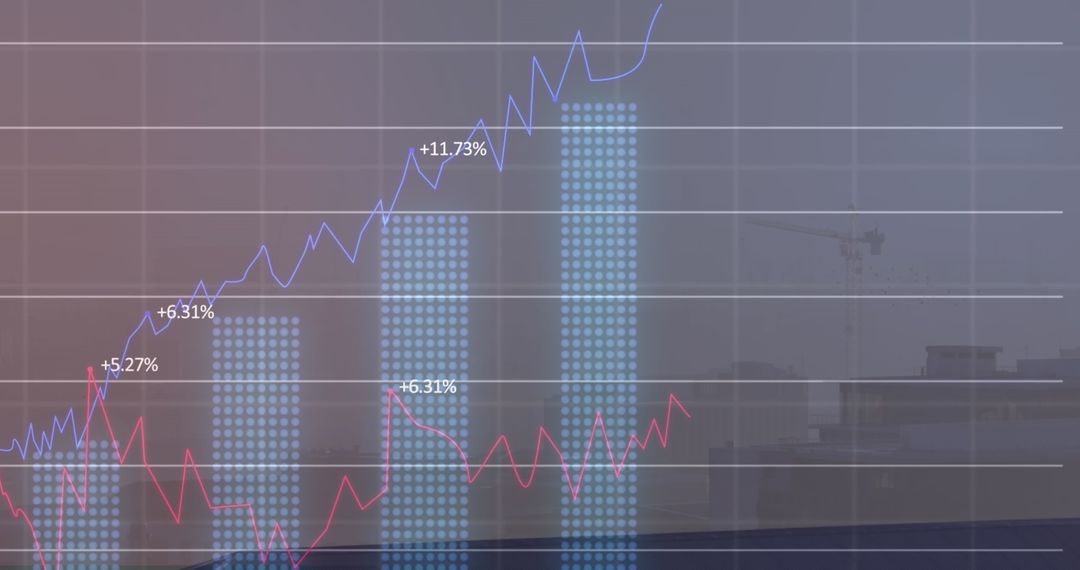
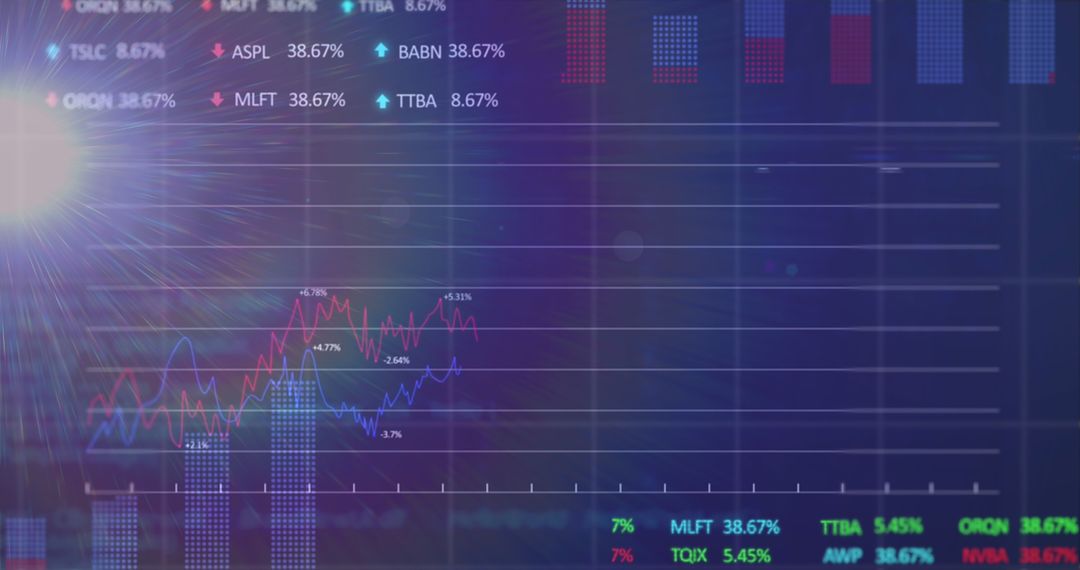
- Growth Charts and Data Analysis Visual Illustration
Growth Charts and Data Analysis Visual Illustration Image

The image features digital representations of growth charts and data analysis with various line and bar graphs, set against a blue background. Light effects highlight the dynamic nature of financial or technological processes, conveying themes of progress and innovation. Useful for presentations, articles, or reports on business growth, financial analysis, global trade, data-driven decision making, or technological advancements.
Powered by  - Get 15% off with code: PIKWIZARD15


2
downloads
downloads
Tags:
More
Credit Photo
If you would like to credit the Photo, here are some ways you can do so
Text Link
photo Link
<span class="text-link">
<span>
<a target="_blank" href=https://pikwizard.com/photo/growth-charts-and-data-analysis-visual-illustration/366d7b2686e71c834229a639cb499be0/>PikWizard</a>
</span>
</span>
<span class="image-link">
<span
style="margin: 0 0 20px 0; display: inline-block; vertical-align: middle; width: 100%;"
>
<a
target="_blank"
href="https://pikwizard.com/photo/growth-charts-and-data-analysis-visual-illustration/366d7b2686e71c834229a639cb499be0/"
style="text-decoration: none; font-size: 10px; margin: 0;"
>
<img src="https://pikwizard.com/pw/medium/366d7b2686e71c834229a639cb499be0.jpg" style="margin: 0; width: 100%;" alt="" />
<p style="font-size: 12px; margin: 0;">PikWizard</p>
</a>
</span>
</span>
Free (free of charge)
Free for personal and commercial use.
Author: Authentic Images
Similar Free Stock Images

Premium


Premium


Premium


Premium


Premium


Premium


Premium


Premium


Premium


Premium


Premium


Premium


Premium


Premium


Premium


Premium


Premium


Premium


Premium


Premium


Premium


Premium


Premium


Premium