
- Home >
- Stock Photos >
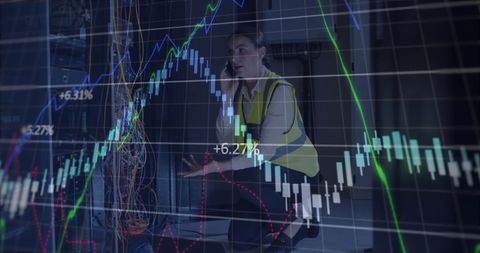
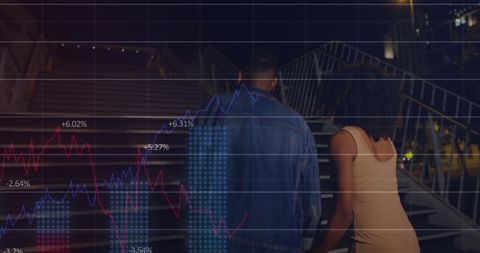
- Hand Interacting with Digital Financial Graph Interactive Analysis
Hand Interacting with Digital Financial Graph Interactive Analysis Image

Image visualizes concept of digital financial analytics, ideal for use in articles about fintech advancements or presentations on economic trends. Suitable for blogs on stock market analyses or promoting financial technology solutions. Conveys a modern, interconnected theme of data interaction.
Powered by  - Get 15% off with code: PIKWIZARD15


downloads
Tags:
More
Credit Photo
If you would like to credit the Photo, here are some ways you can do so
Text Link
photo Link
<span class="text-link">
<span>
<a target="_blank" href=https://pikwizard.com/photo/hand-interacting-with-digital-financial-graph-interactive-analysis/d9f7762517ff35249c2a6254c88f6568/>PikWizard</a>
</span>
</span>
<span class="image-link">
<span
style="margin: 0 0 20px 0; display: inline-block; vertical-align: middle; width: 100%;"
>
<a
target="_blank"
href="https://pikwizard.com/photo/hand-interacting-with-digital-financial-graph-interactive-analysis/d9f7762517ff35249c2a6254c88f6568/"
style="text-decoration: none; font-size: 10px; margin: 0;"
>
<img src="https://pikwizard.com/pw/medium/d9f7762517ff35249c2a6254c88f6568.jpg" style="margin: 0; width: 100%;" alt="" />
<p style="font-size: 12px; margin: 0;">PikWizard</p>
</a>
</span>
</span>
Free (free of charge)
Free for personal and commercial use.
Author: People Creations
Similar Free Stock Images

Premium


Premium


Premium


Premium


Premium


Premium


Premium

Premium


Premium

Premium


Premium

Premium

Premium


Premium

Premium

Premium


Premium


Premium


Premium


Premium

Premium

Premium


Premium


Premium


Premium


Explore More Free Stock Images