- Home >
- Stock Photos >
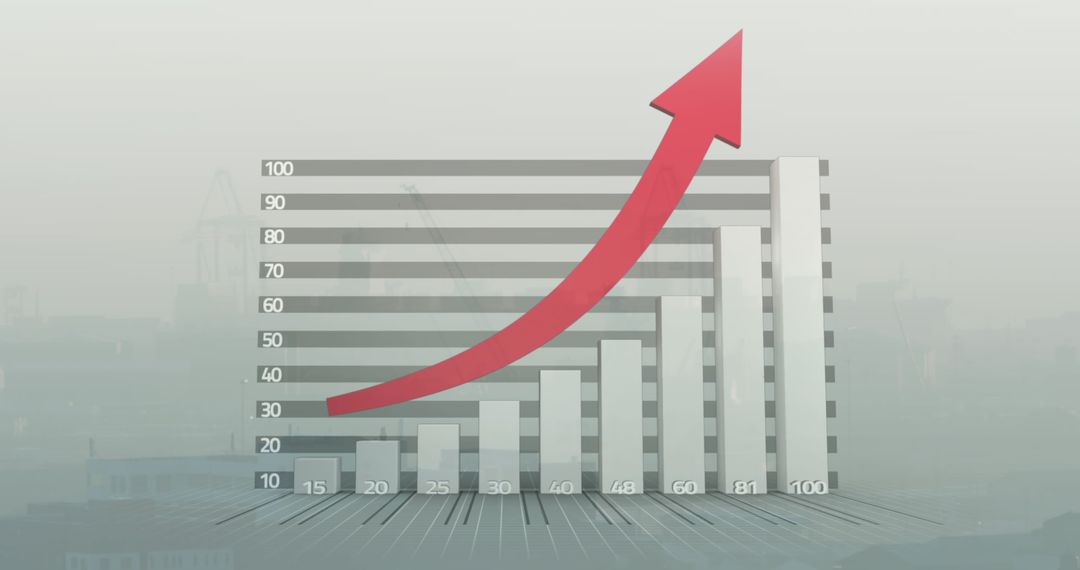
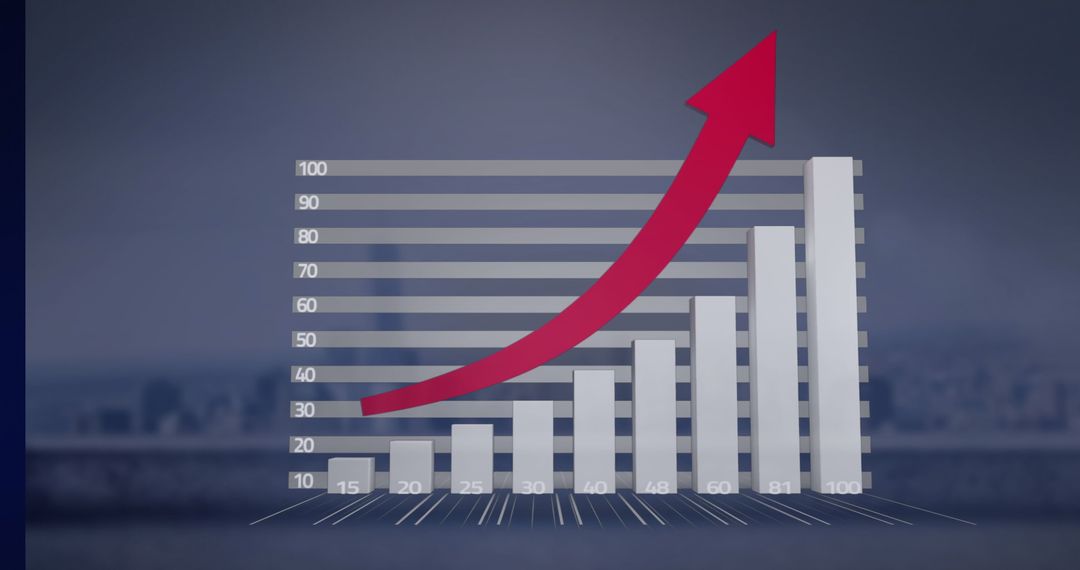
- Hand Pointing at Rising Bar Graph Projecting Growth
Hand Pointing at Rising Bar Graph Projecting Growth Image

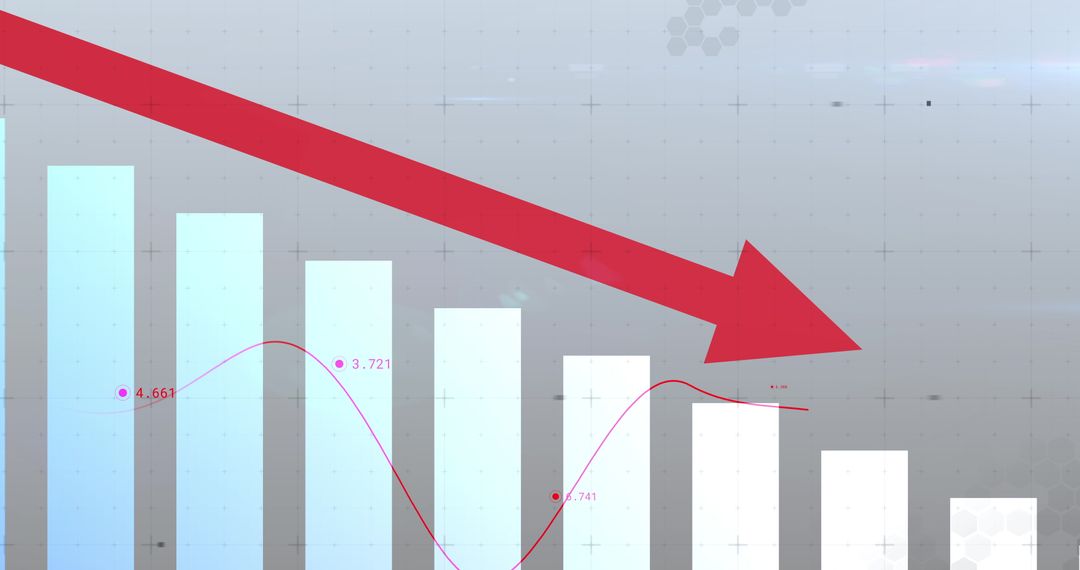
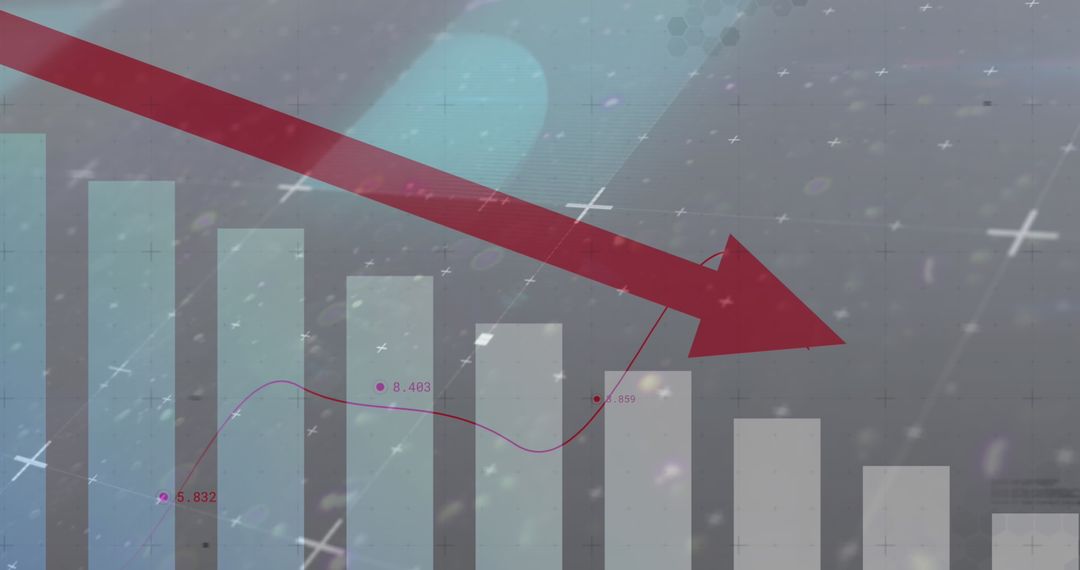
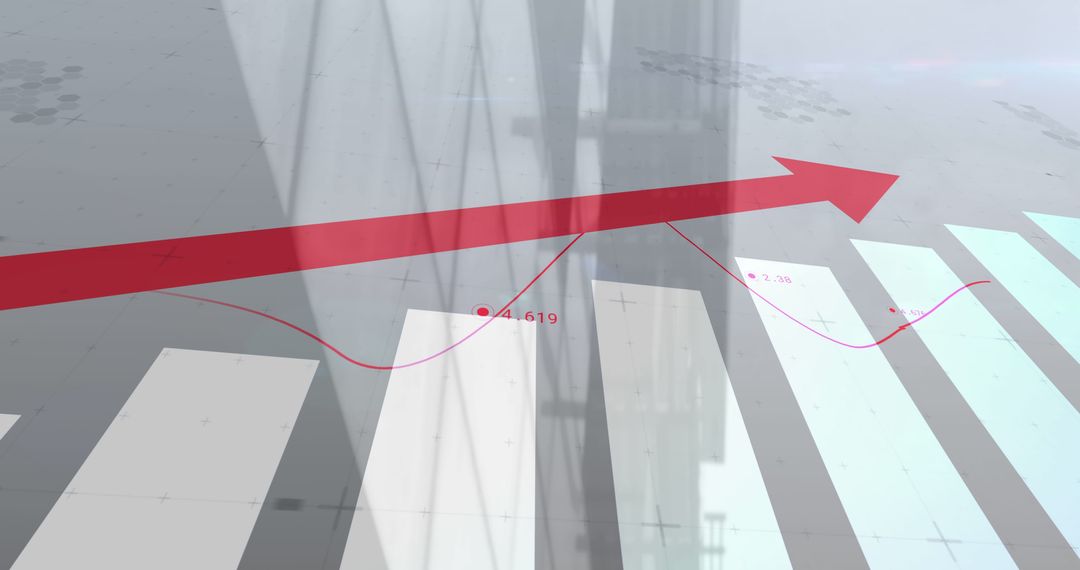
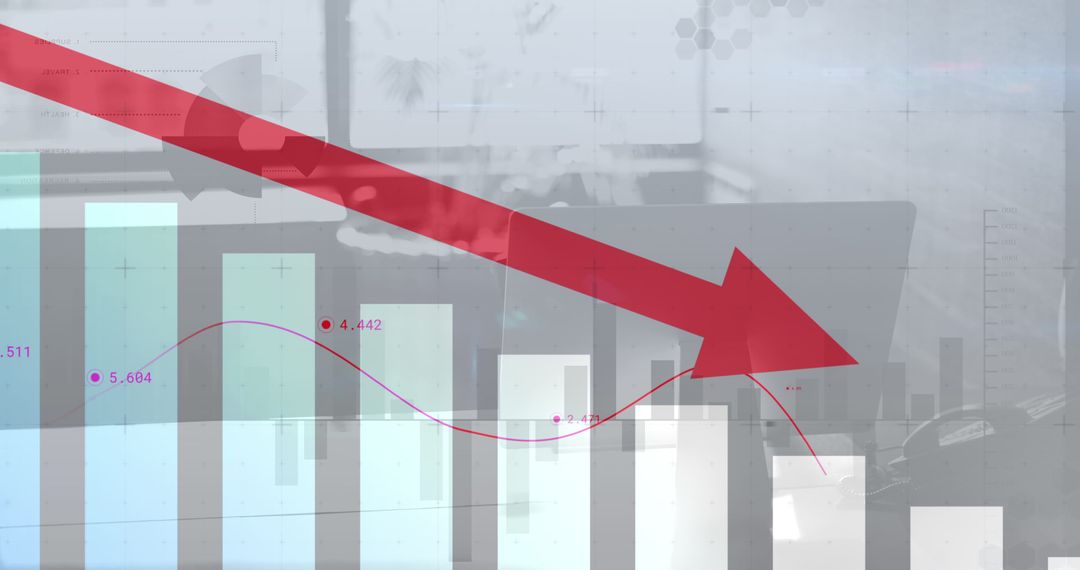
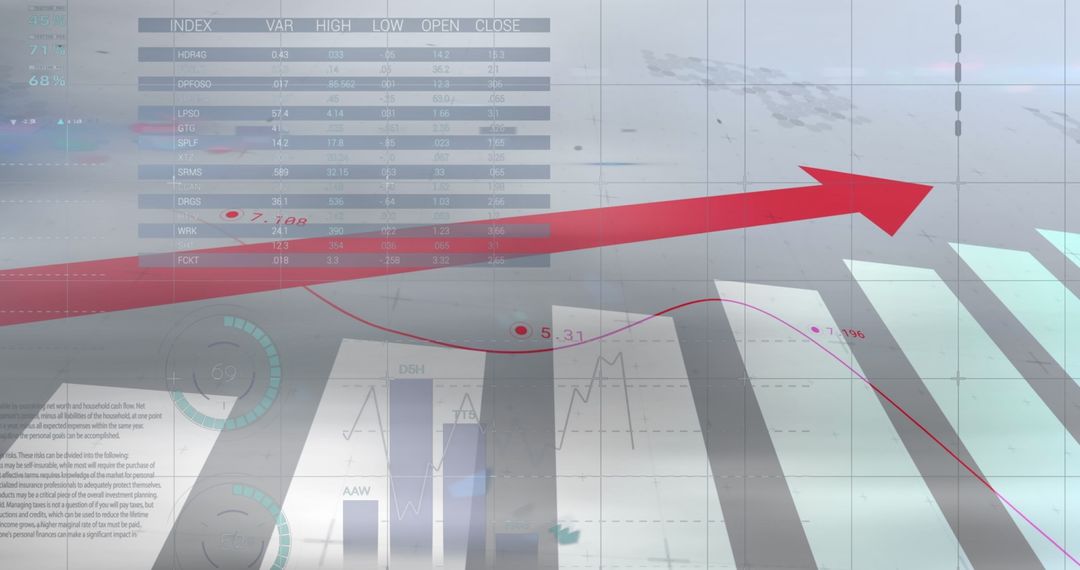
Hand pointing at a chalk-drawn bar graph with a red line indicating upward growth and success. This visualization can be used in presentations, articles on business growth strategies, and investment forecasts to exemplify positive progress and financial increase.
Powered by 


Credit Photo
If you would like to credit the Photo, here are some ways you can do so
Text Link
photo Link
<span class="text-link">
<span>
<a target="_blank" href=https://pikwizard.com/photo/hand-pointing-at-rising-bar-graph-projecting-growth/f92578f9429a15cd45ec5ef92af5341d/>PikWizard</a>
</span>
</span>
<span class="image-link">
<span
style="margin: 0 0 20px 0; display: inline-block; vertical-align: middle; width: 100%;"
>
<a
target="_blank"
href="https://pikwizard.com/photo/hand-pointing-at-rising-bar-graph-projecting-growth/f92578f9429a15cd45ec5ef92af5341d/"
style="text-decoration: none; font-size: 10px; margin: 0;"
>
<img src="https://pikwizard.com/pw/medium/f92578f9429a15cd45ec5ef92af5341d.jpg" style="margin: 0; width: 100%;" alt="" />
<p style="font-size: 12px; margin: 0;">PikWizard</p>
</a>
</span>
</span>
Free (free of charge)
Free for personal and commercial use.
Author: Creative Art
Similar Free Stock Images

Premium


Premium


Premium


Premium


Premium


Premium


Premium


Premium


Premium


Premium


Premium


Premium


Premium


Premium


Premium


Premium


Premium


Premium


Premium


Premium


Premium


Premium


Premium


Premium