- Home >
- Stock Photos >
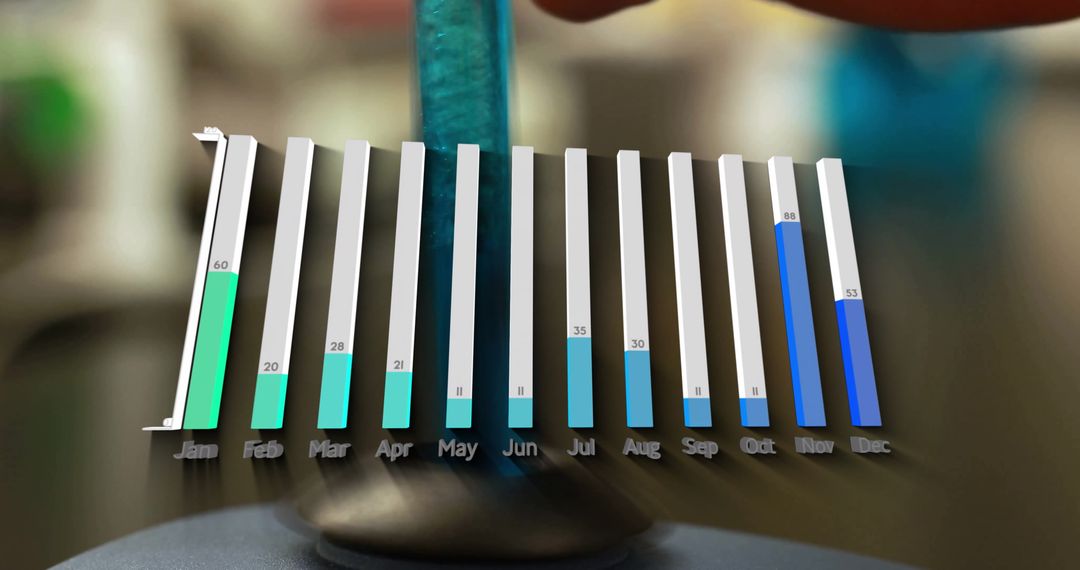
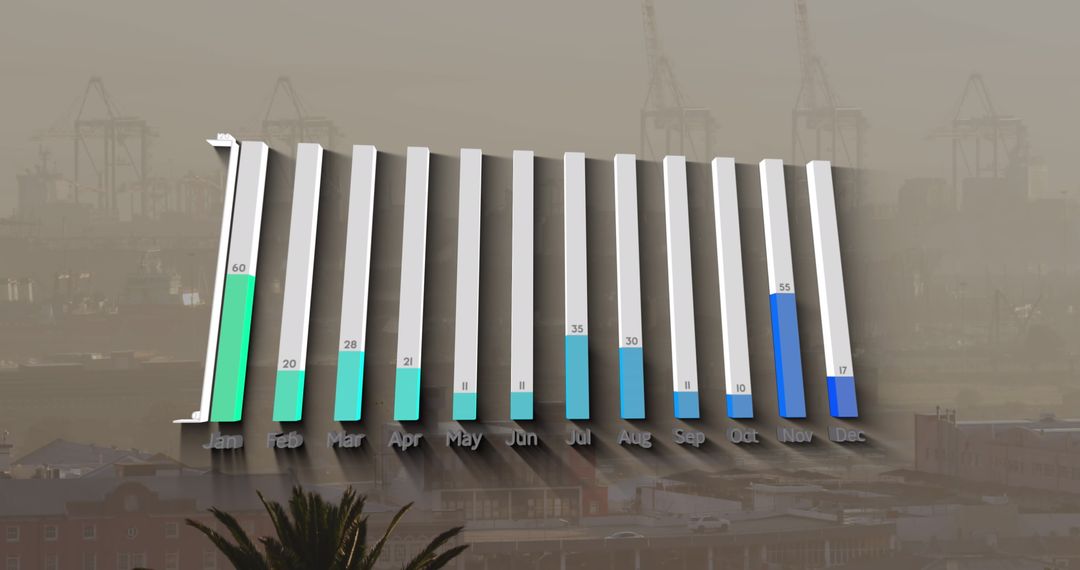
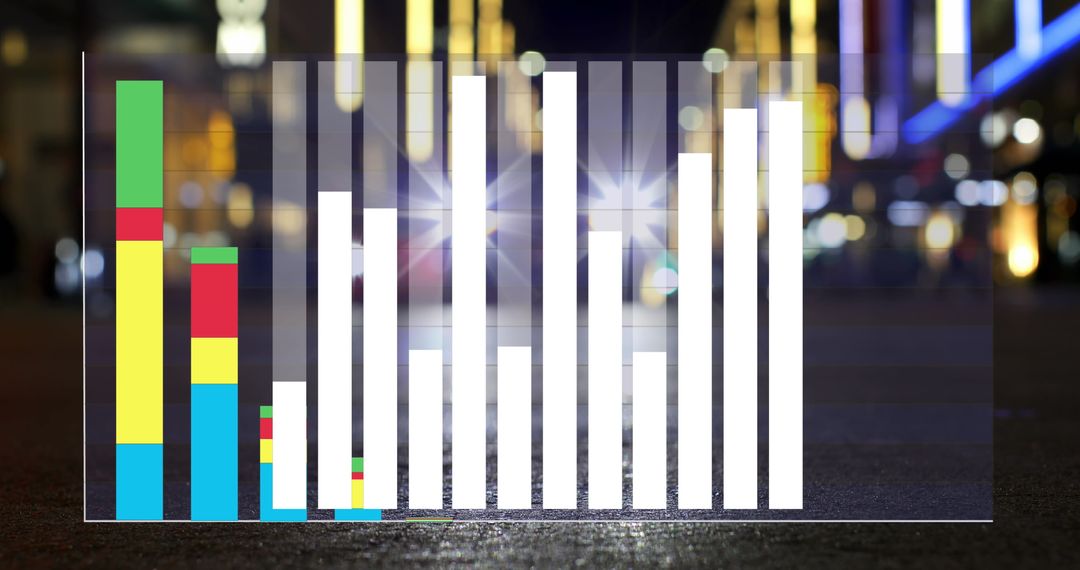
- Hands Examining Stats and Data Behind Urban Skyline
Hands Examining Stats and Data Behind Urban Skyline Image

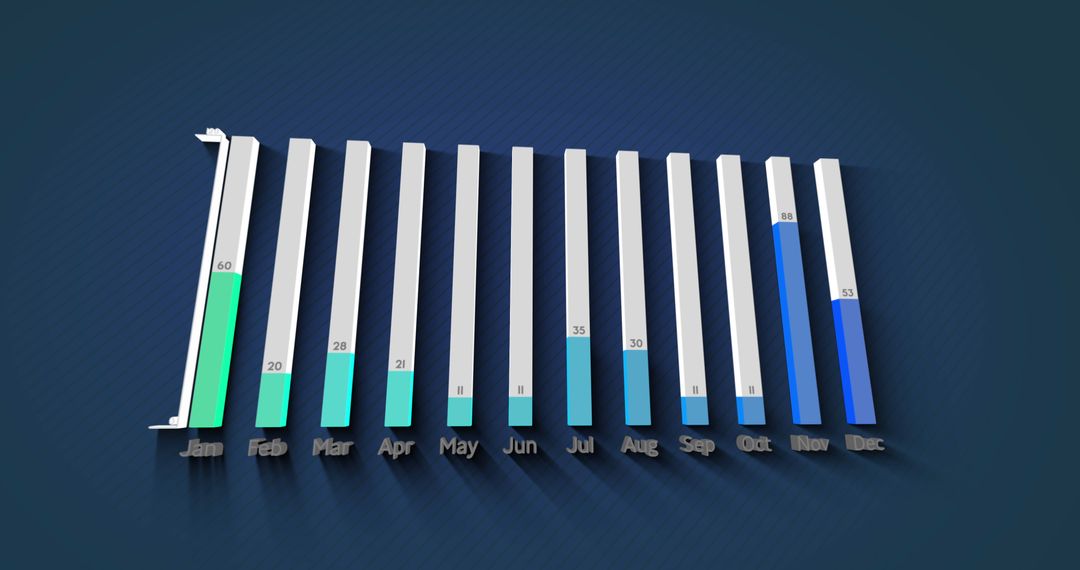
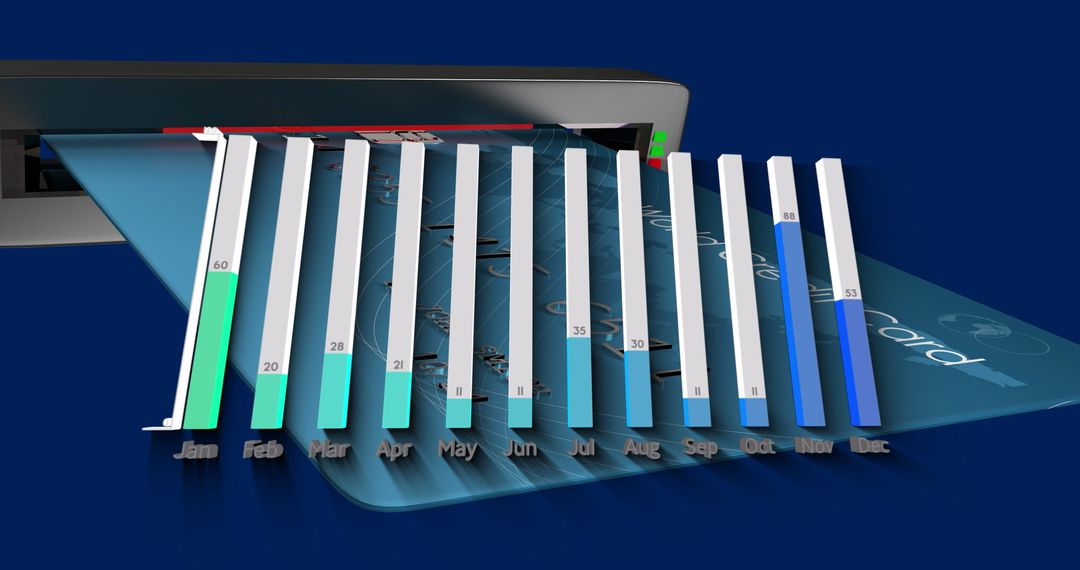
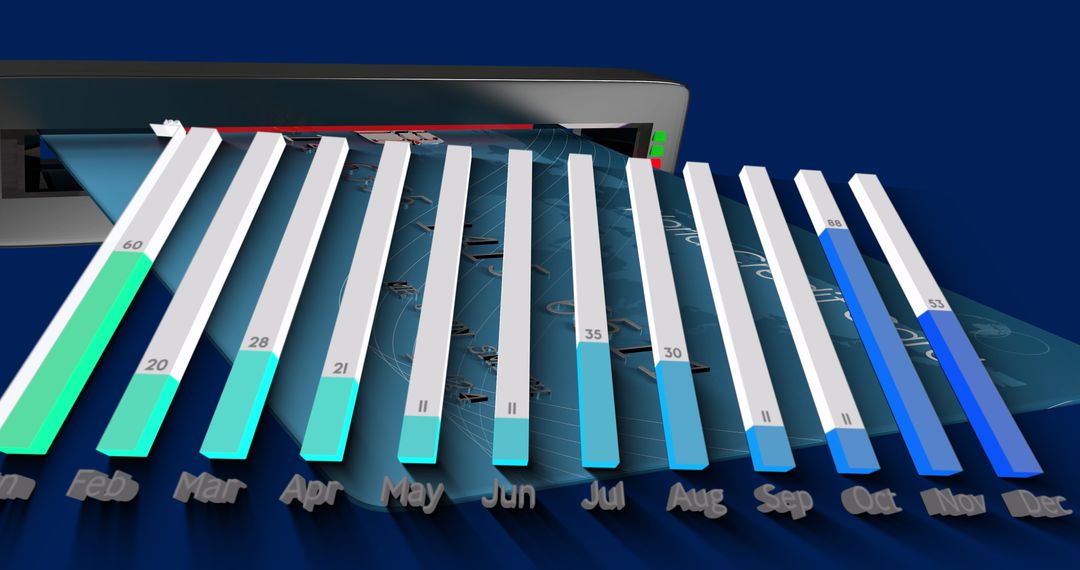
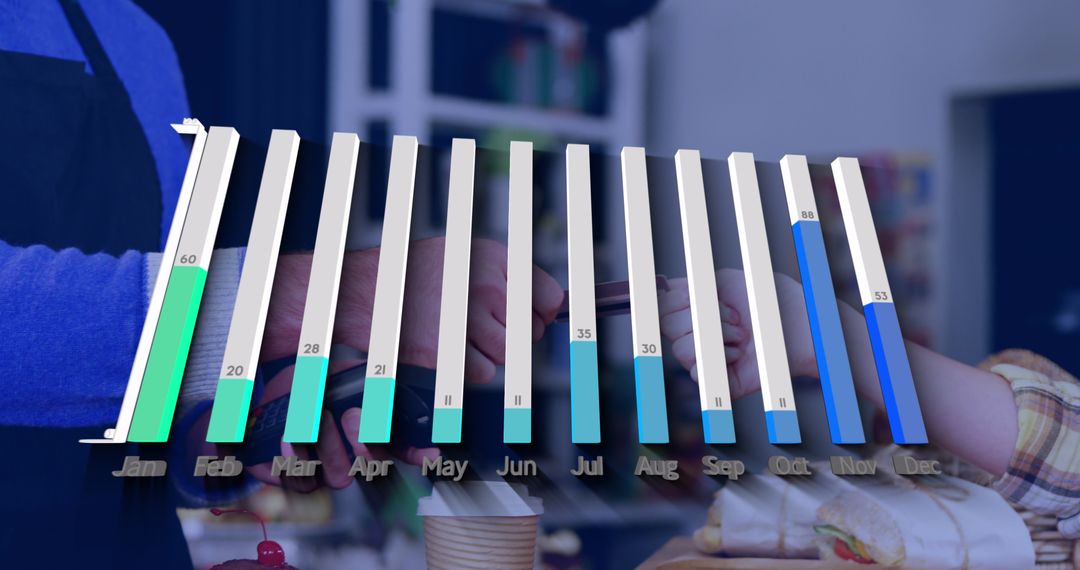
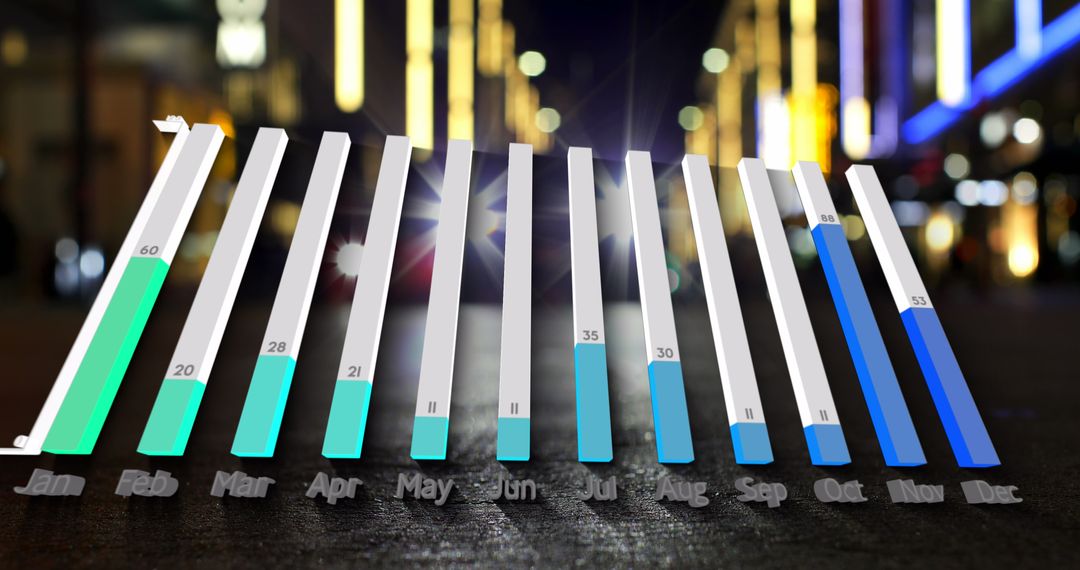
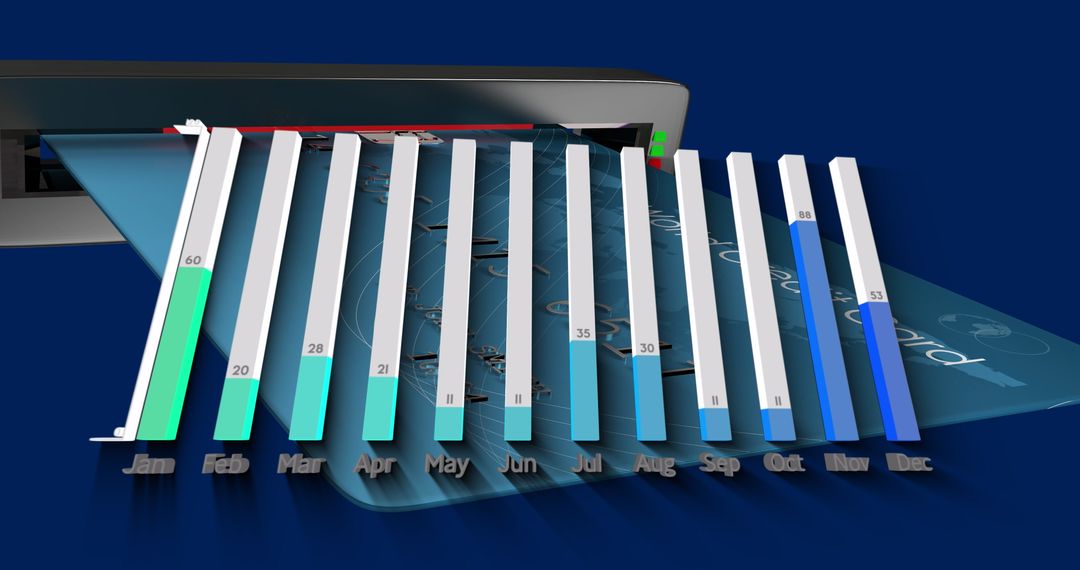
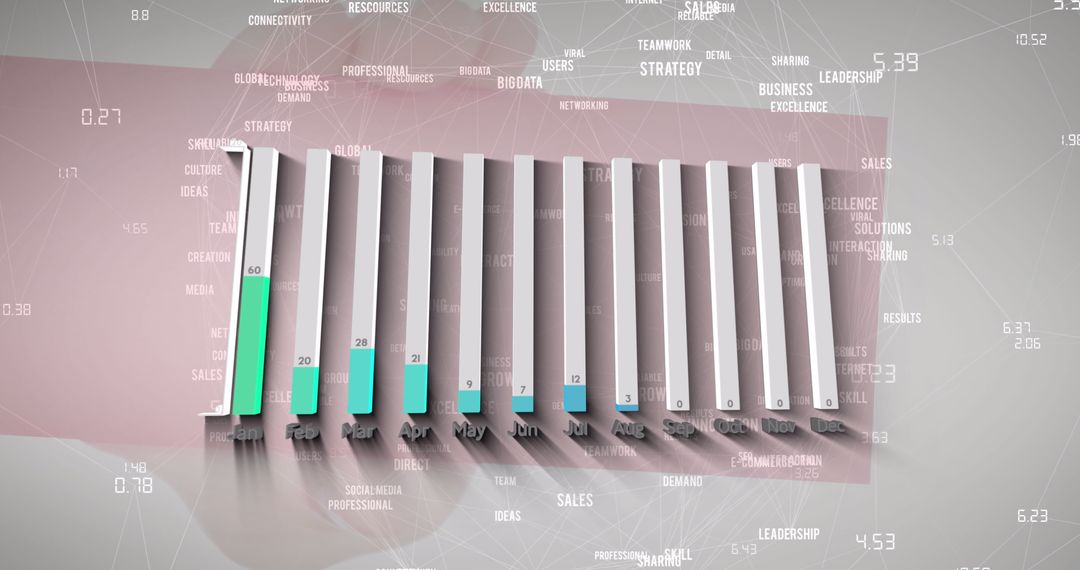
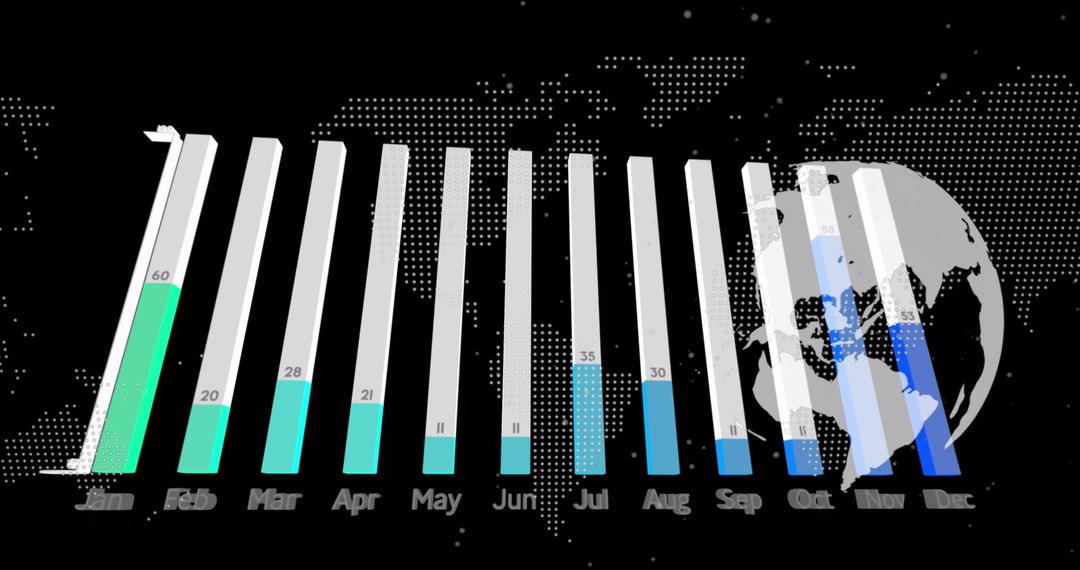
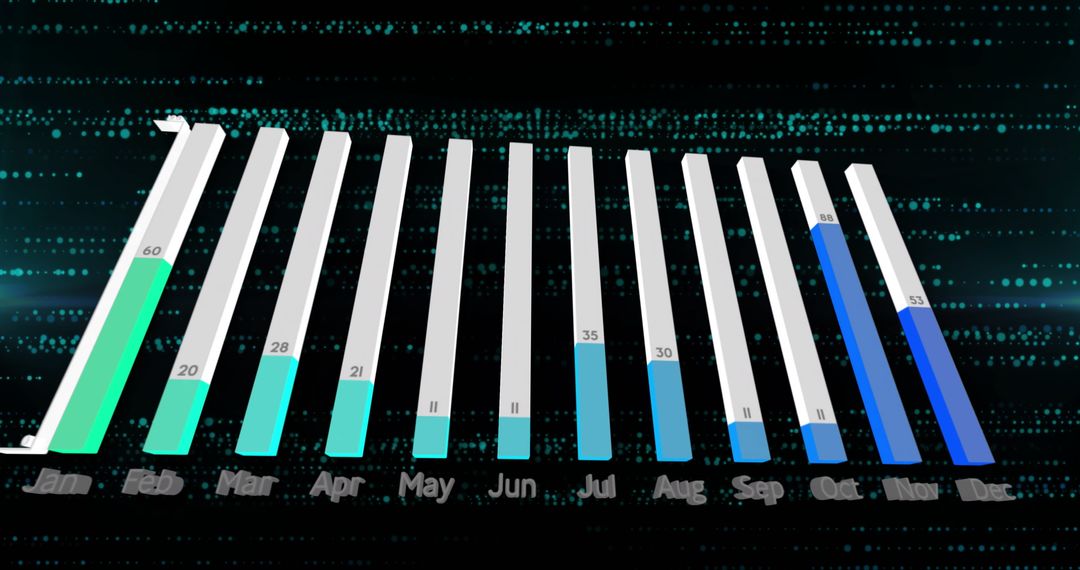
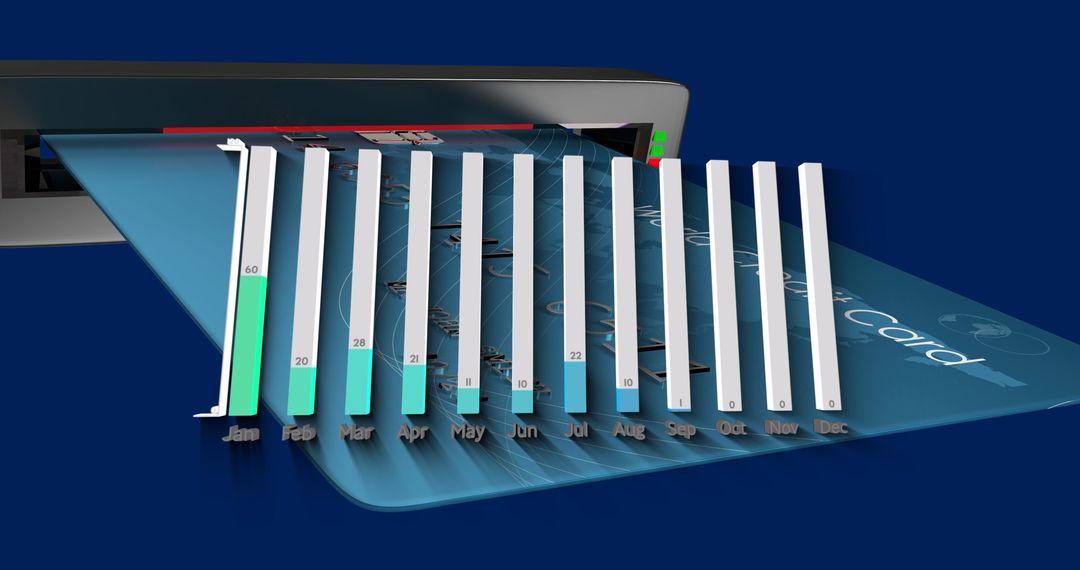
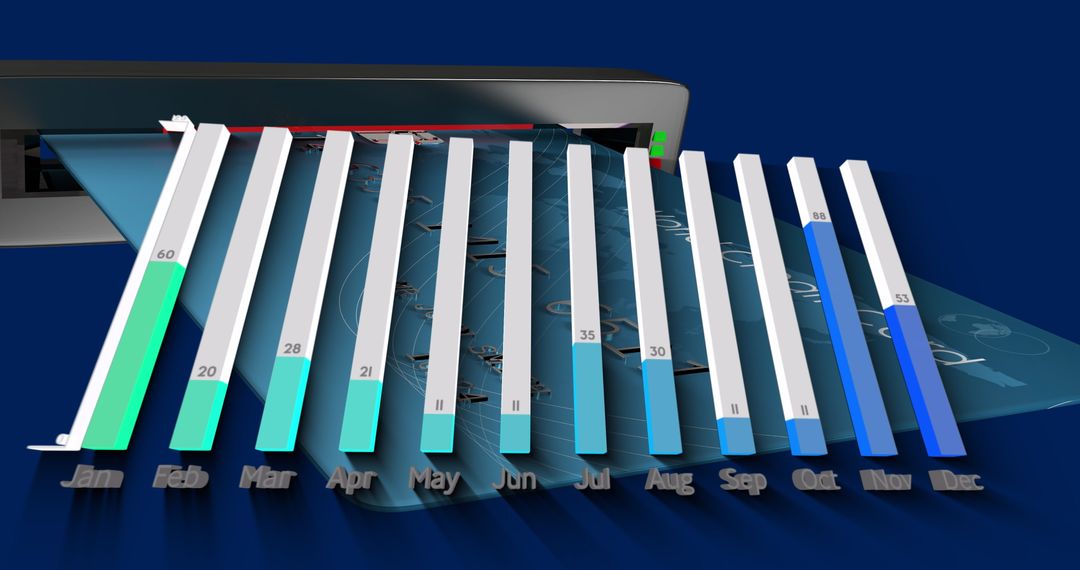
Illustrates technology concept with digital bar graph superimposed on urban setting. Suitable for topics involving technology, data analysis, urban studies and statistics. Ideal for articles or presentations about digital trends, data processing, city development.
Powered by  - Get 15% off with code: PIKWIZARD15


2
downloads
downloads
Tags:
More
Credit Photo
If you would like to credit the Photo, here are some ways you can do so
Text Link
photo Link
<span class="text-link">
<span>
<a target="_blank" href=https://pikwizard.com/photo/hands-examining-stats-and-data-behind-urban-skyline/3c60409bdf5753e36a533c49c2fc2bd3/>PikWizard</a>
</span>
</span>
<span class="image-link">
<span
style="margin: 0 0 20px 0; display: inline-block; vertical-align: middle; width: 100%;"
>
<a
target="_blank"
href="https://pikwizard.com/photo/hands-examining-stats-and-data-behind-urban-skyline/3c60409bdf5753e36a533c49c2fc2bd3/"
style="text-decoration: none; font-size: 10px; margin: 0;"
>
<img src="https://pikwizard.com/pw/medium/3c60409bdf5753e36a533c49c2fc2bd3.jpg" style="margin: 0; width: 100%;" alt="" />
<p style="font-size: 12px; margin: 0;">PikWizard</p>
</a>
</span>
</span>
Free (free of charge)
Free for personal and commercial use.
Author: Awesome Content
Similar Free Stock Images
Premium


Premium


Premium


Premium


Premium


Premium


Premium


Premium


Premium


Premium


Premium


Premium


Premium


Premium


Premium


Premium