
- Home >
- Stock Photos >
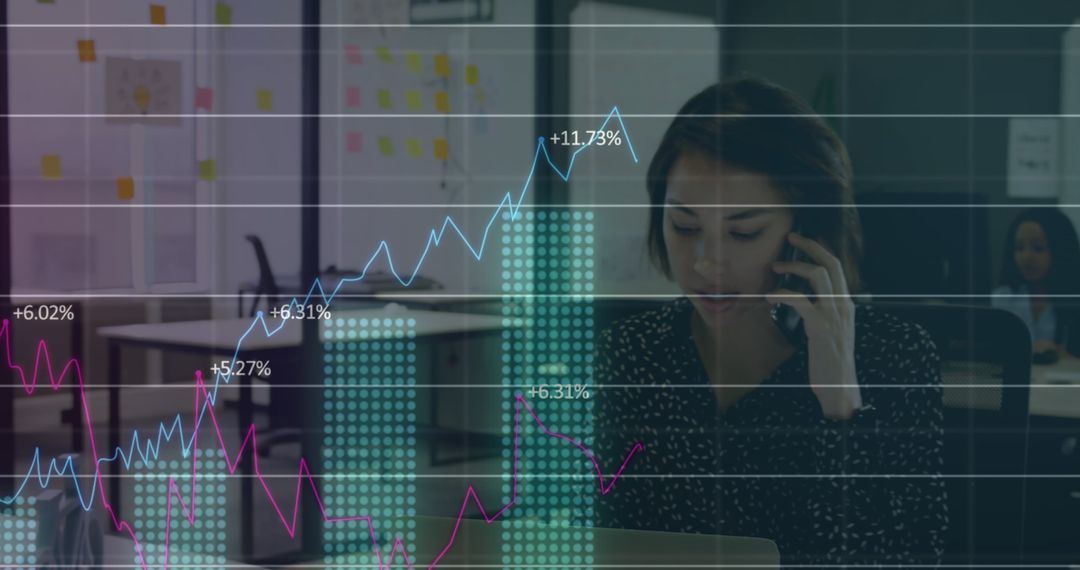
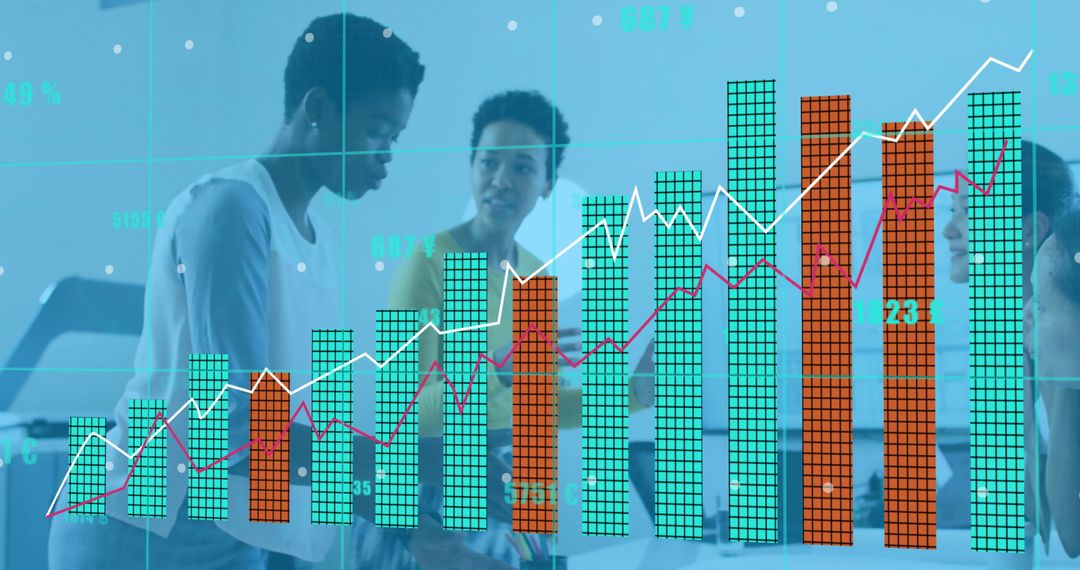
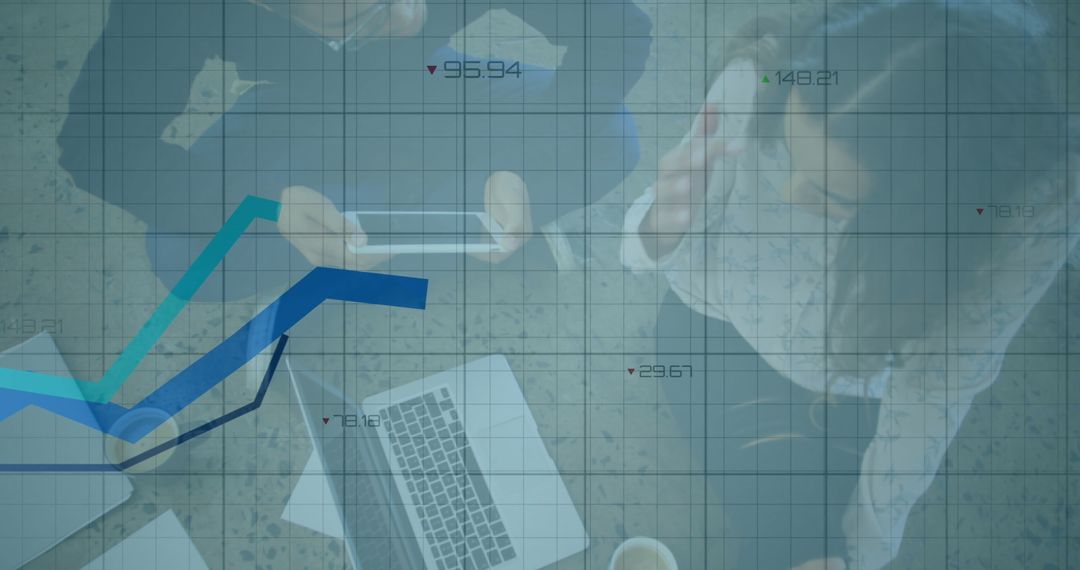
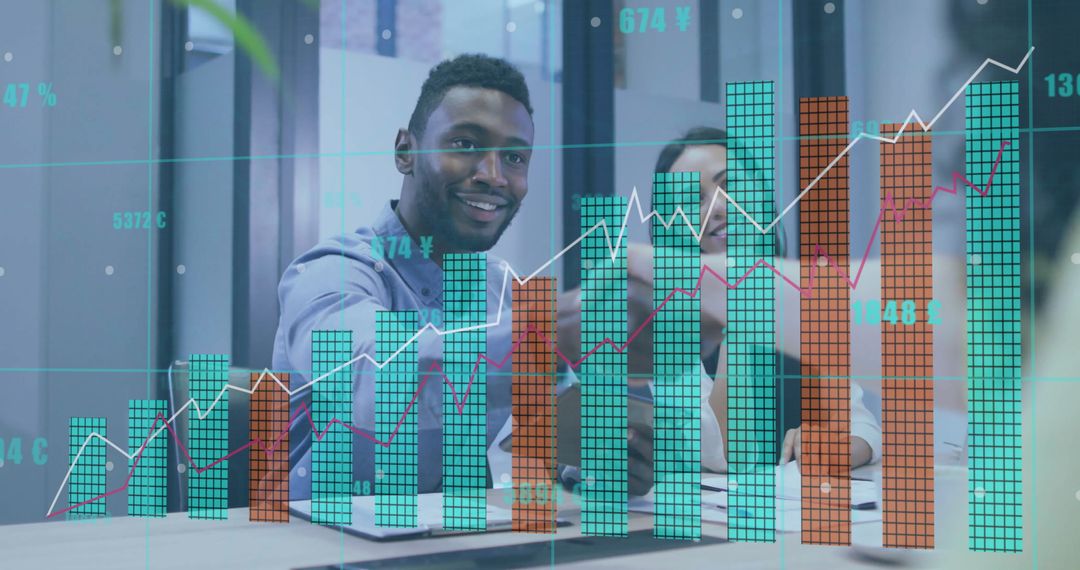
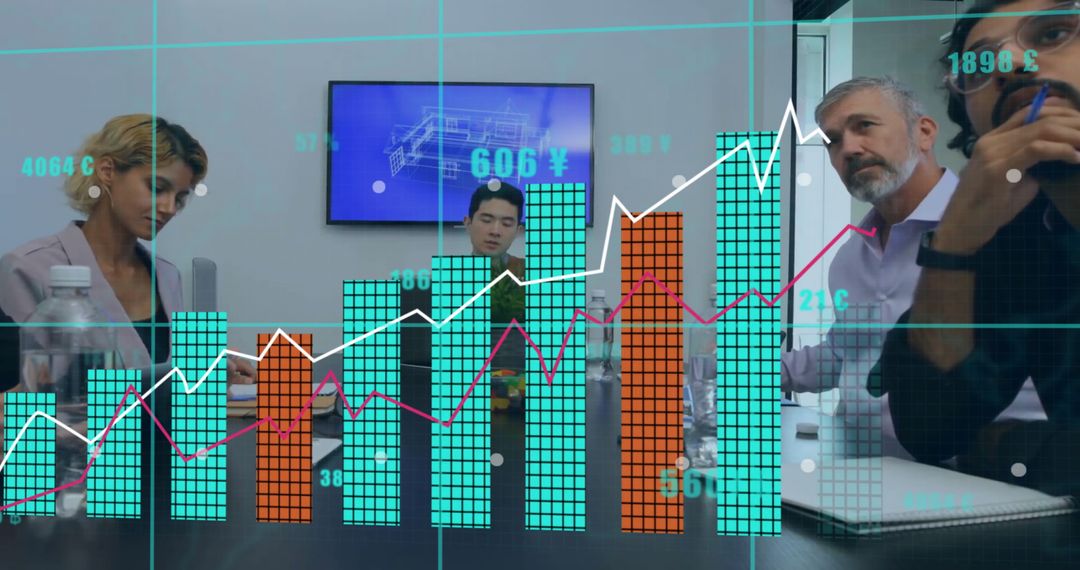
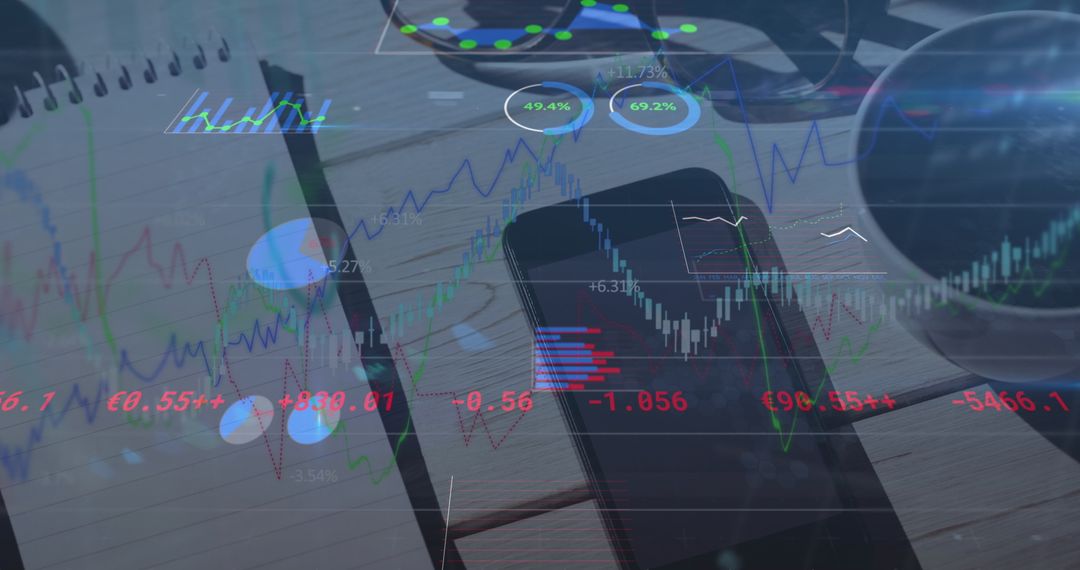
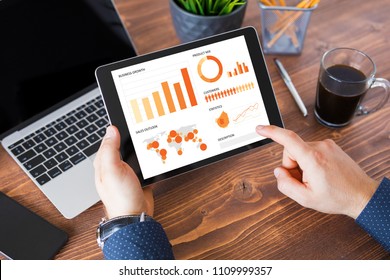
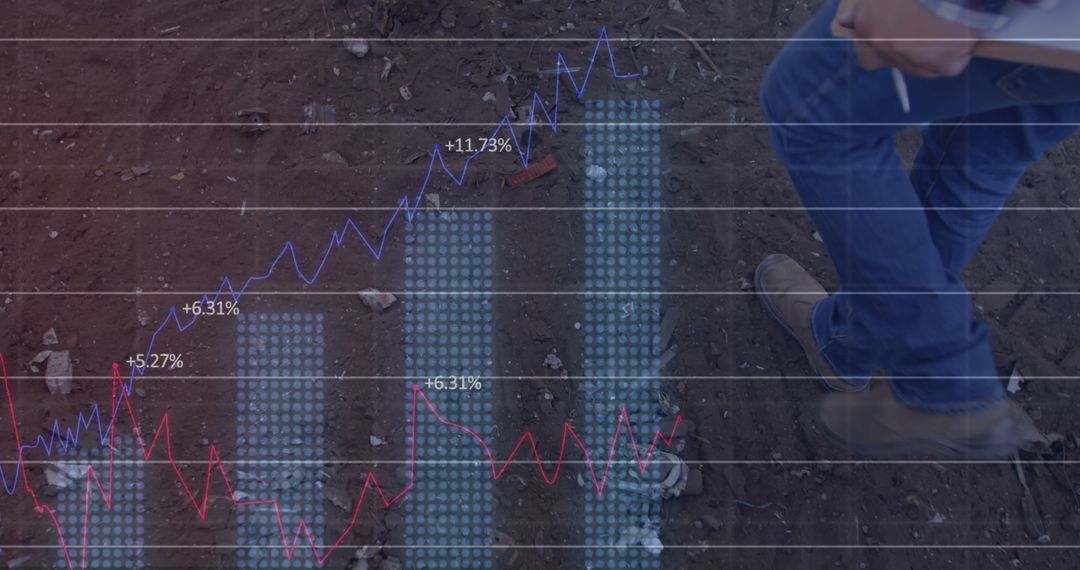
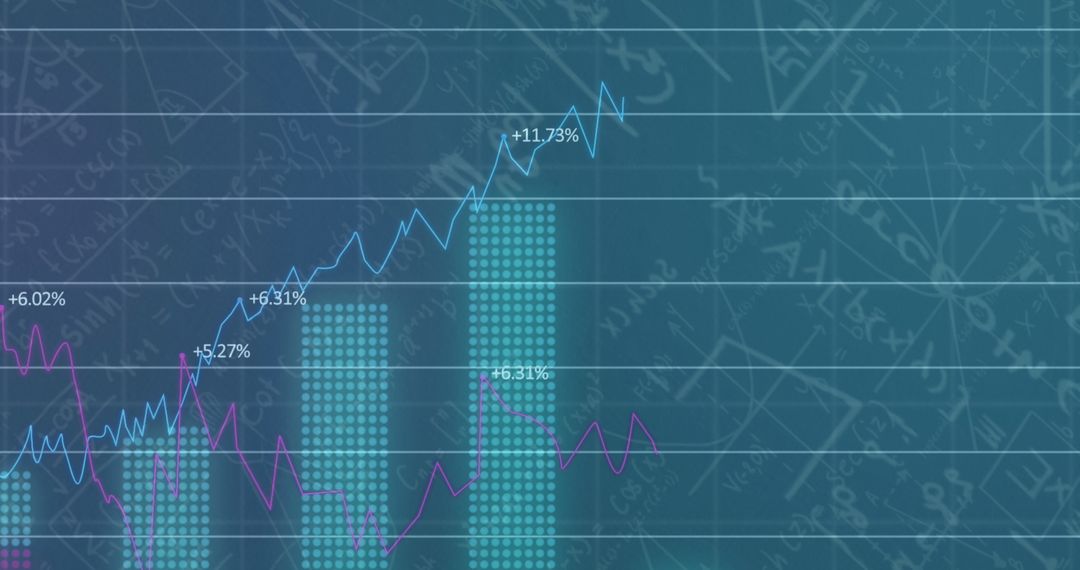
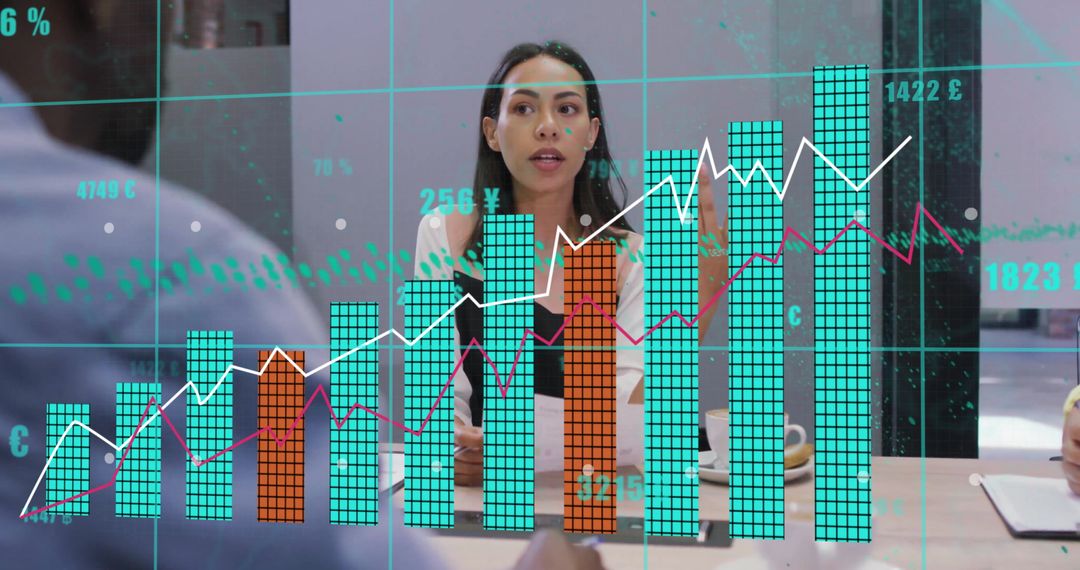
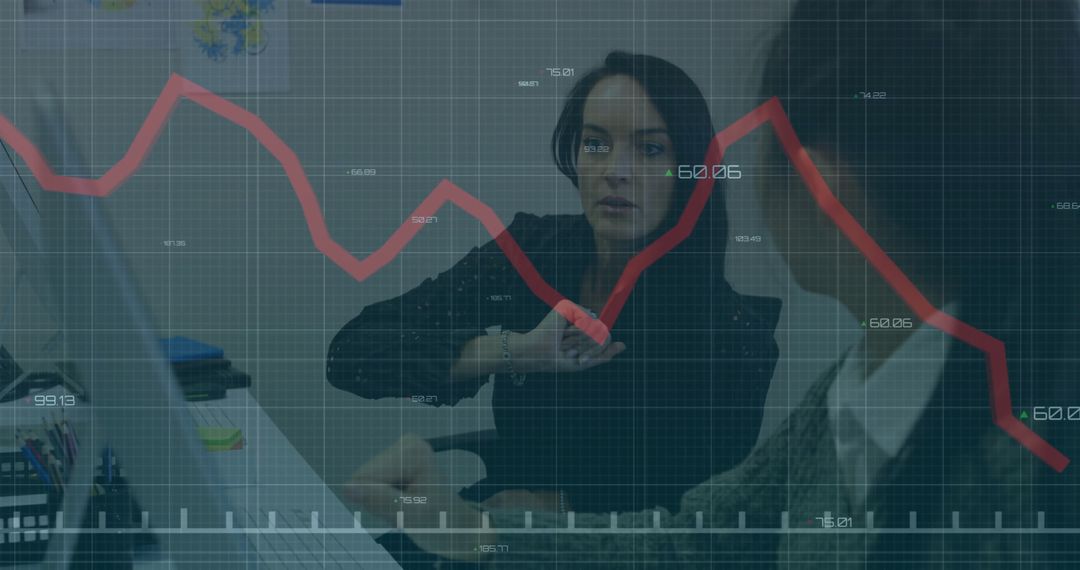
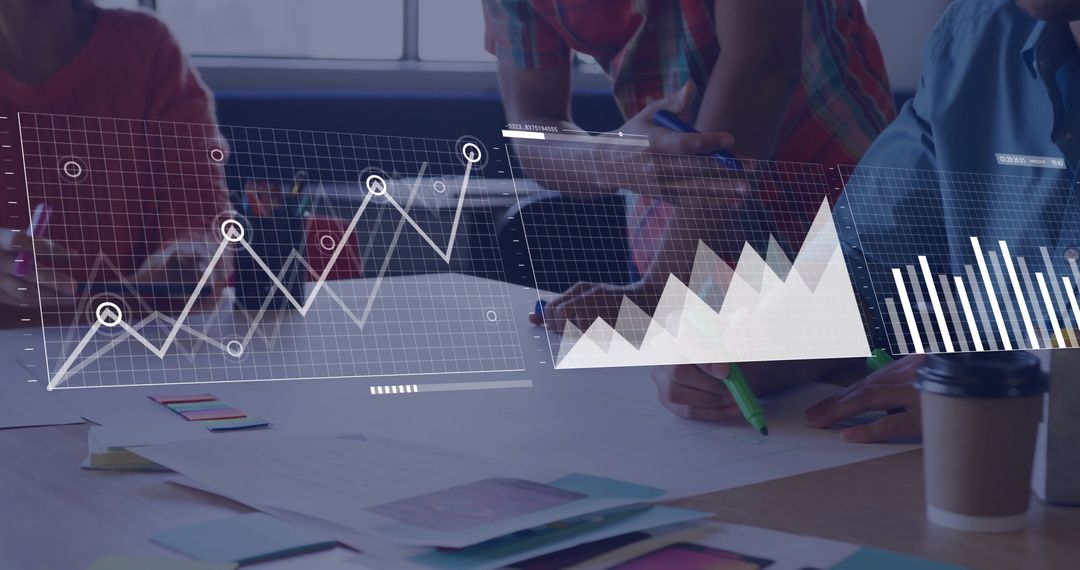
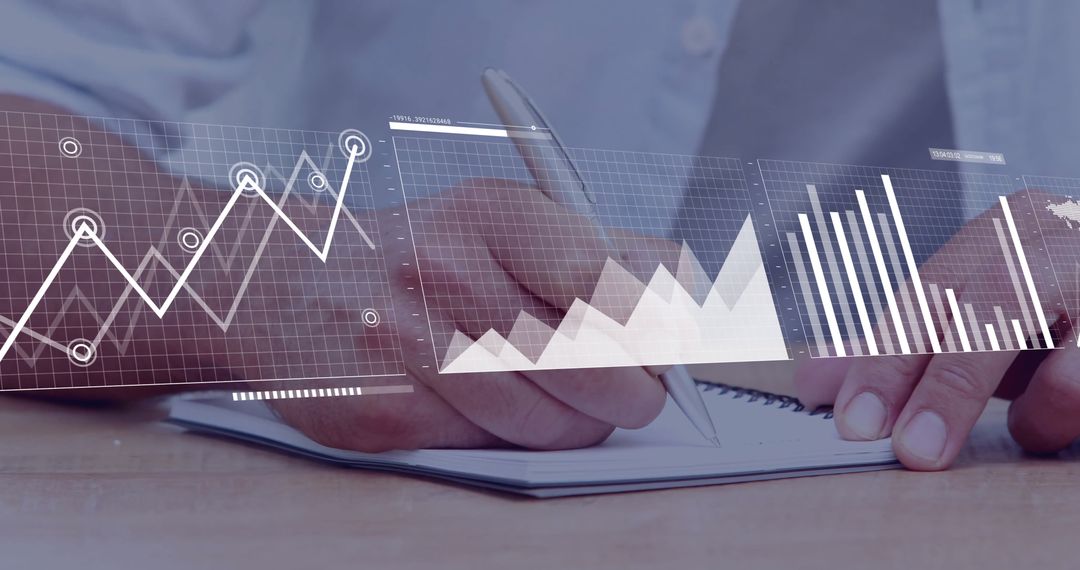
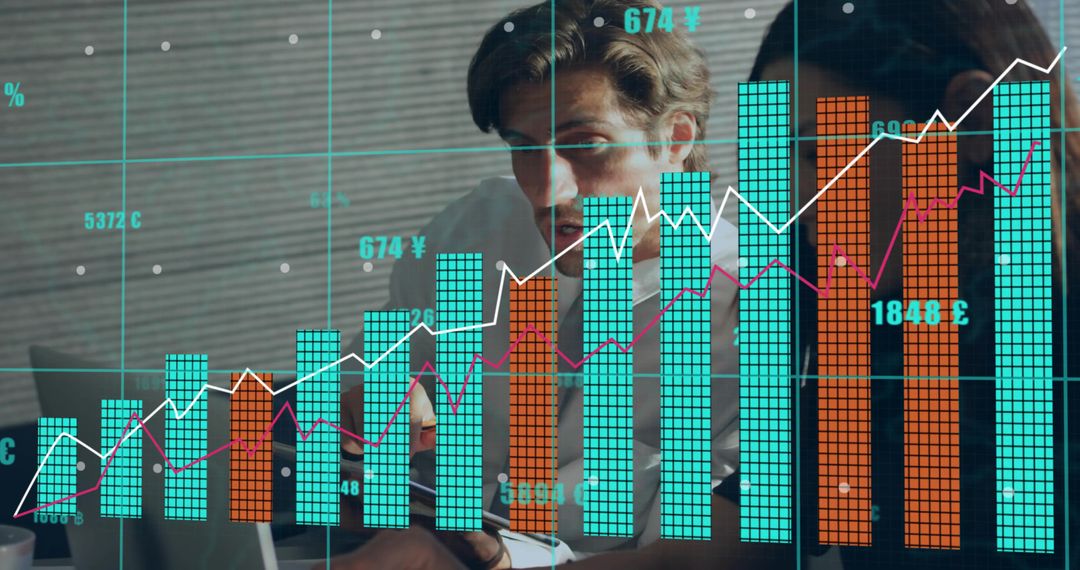
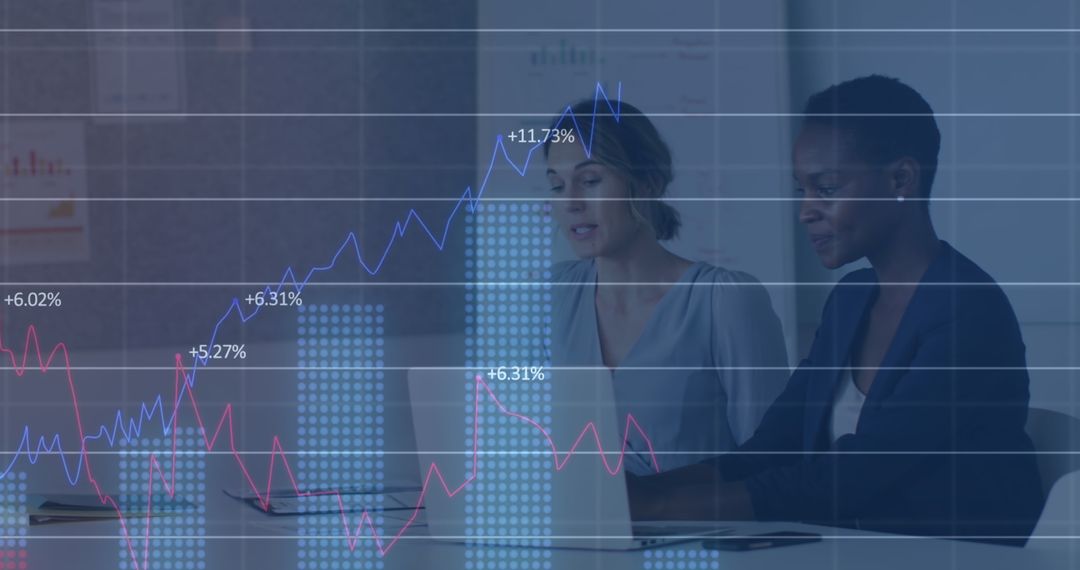
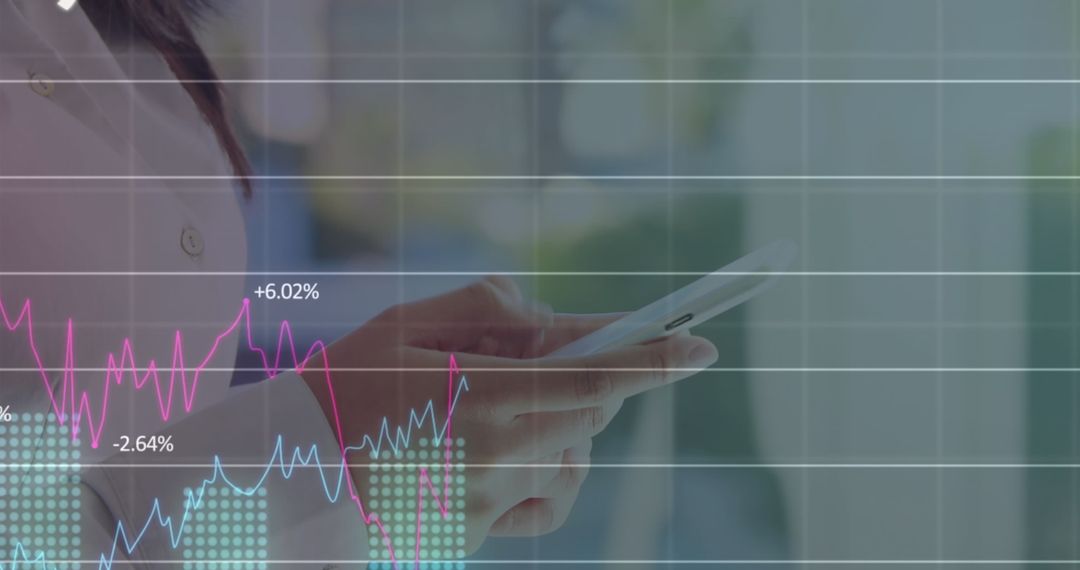
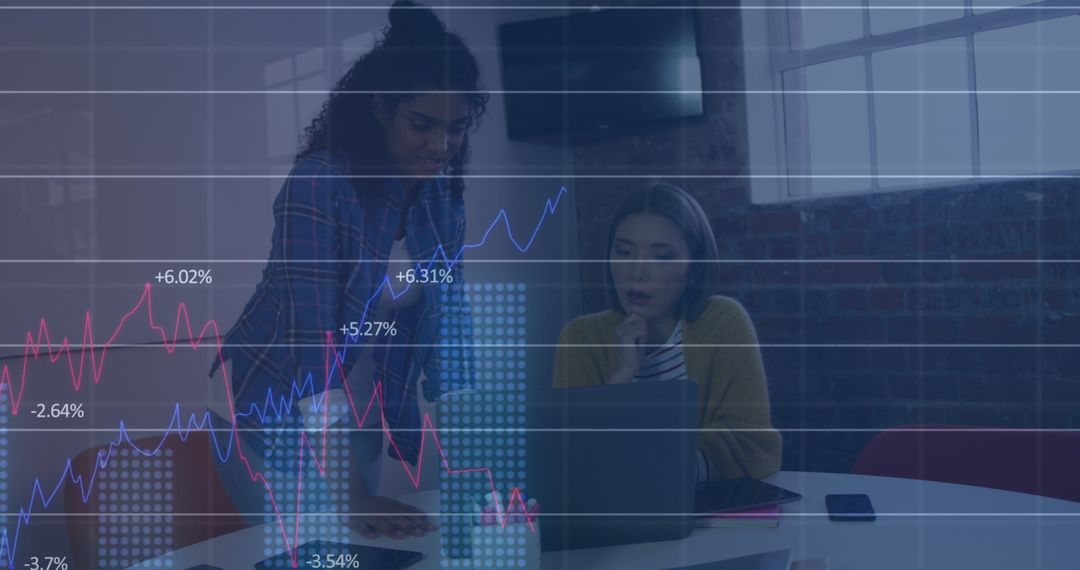
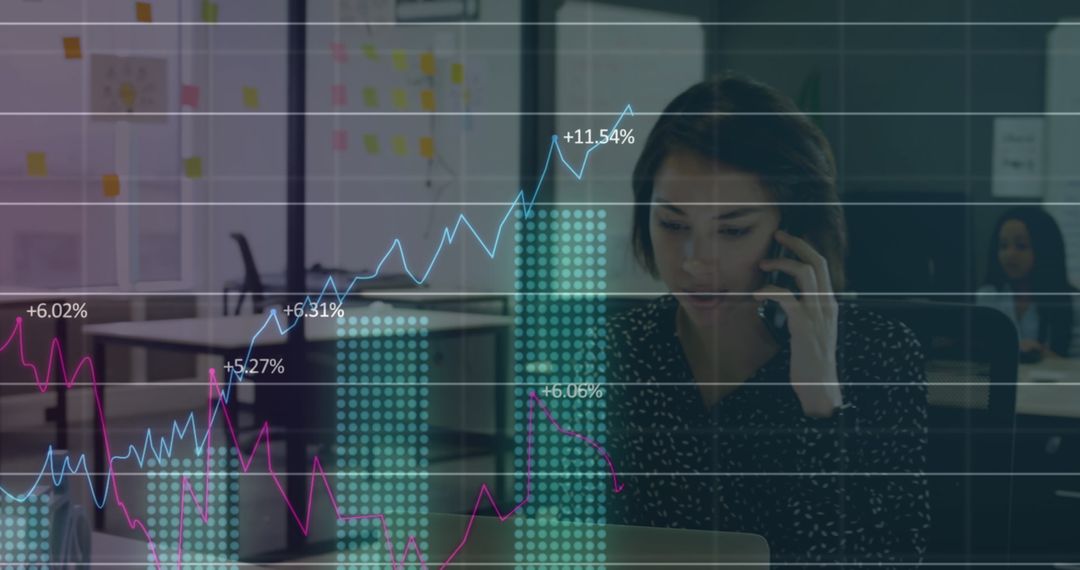
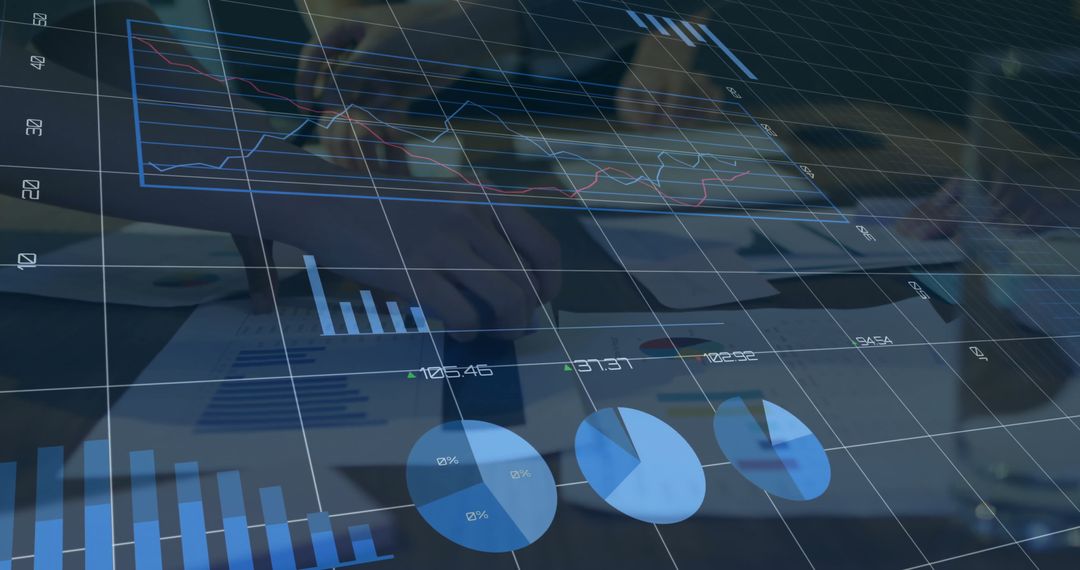
- Hands Using Tablet with Overlay of Financial Graphs and Data
Hands Using Tablet with Overlay of Financial Graphs and Data Image
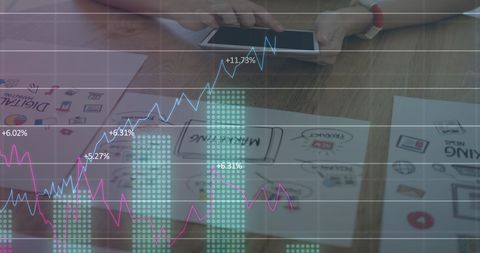
Illustrates business strategy and financial analysis with hands using tablet and overlay of digital graphs. Useful for articles about economic trends, technology in finance, and market analysis insights. Ideal for business presentations, reports discussing data-driven decision-making, or as a visual representation of economic forecasting and investment strategies.
Powered by  - Get 15% off with code: PIKWIZARD15


2
downloads
downloads
Tags:
More
Credit Photo
If you would like to credit the Photo, here are some ways you can do so
Text Link
photo Link
<span class="text-link">
<span>
<a target="_blank" href=https://pikwizard.com/photo/hands-using-tablet-with-overlay-of-financial-graphs-and-data/cba3e52868474ec18ba772a20c89027b/>PikWizard</a>
</span>
</span>
<span class="image-link">
<span
style="margin: 0 0 20px 0; display: inline-block; vertical-align: middle; width: 100%;"
>
<a
target="_blank"
href="https://pikwizard.com/photo/hands-using-tablet-with-overlay-of-financial-graphs-and-data/cba3e52868474ec18ba772a20c89027b/"
style="text-decoration: none; font-size: 10px; margin: 0;"
>
<img src="https://pikwizard.com/pw/medium/cba3e52868474ec18ba772a20c89027b.jpg" style="margin: 0; width: 100%;" alt="" />
<p style="font-size: 12px; margin: 0;">PikWizard</p>
</a>
</span>
</span>
Free (free of charge)
Free for personal and commercial use.
Author: People Creations
Similar Free Stock Images
Premium


Premium


Premium


Premium


Premium


Premium


Premium


Premium


Premium


Premium


Premium


Premium


Premium


Premium


Premium


Premium


Premium


Premium


Premium


Premium

Premium


Premium


Premium


Premium


Premium

