
- Home >
- Stock Photos >
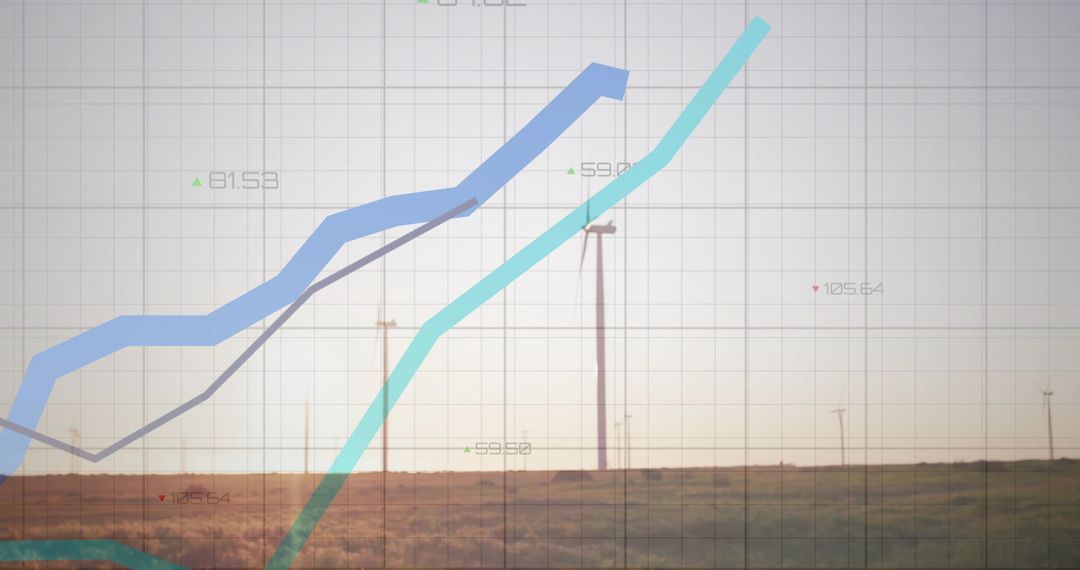
- Harvest Field with Upward Trend Graph Overlaid
Harvest Field with Upward Trend Graph Overlaid Image
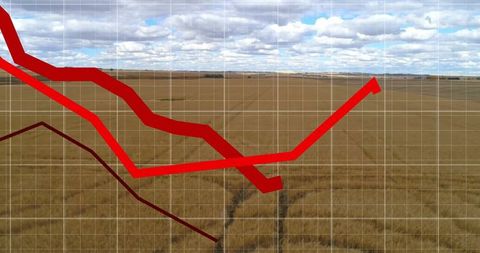
Image combining an upward-thrusting trajectory graph overlay against an expansive, harvested field represents agricultural progress and economic trajectory concepts. Ideal for content focused on growth in farming technology, market trends in agriculture industry, and rural econometrics.
Powered by  - Get 15% off with code: PIKWIZARD15


0
downloads
downloads
Tags:
More
Credit Photo
If you would like to credit the Photo, here are some ways you can do so
Text Link
photo Link
<span class="text-link">
<span>
<a target="_blank" href=https://pikwizard.com/photo/harvest-field-with-upward-trend-graph-overlaid/5b93986414c9806e421e7d5b35d983e9/>PikWizard</a>
</span>
</span>
<span class="image-link">
<span
style="margin: 0 0 20px 0; display: inline-block; vertical-align: middle; width: 100%;"
>
<a
target="_blank"
href="https://pikwizard.com/photo/harvest-field-with-upward-trend-graph-overlaid/5b93986414c9806e421e7d5b35d983e9/"
style="text-decoration: none; font-size: 10px; margin: 0;"
>
<img src="https://pikwizard.com/pw/medium/5b93986414c9806e421e7d5b35d983e9.jpg" style="margin: 0; width: 100%;" alt="" />
<p style="font-size: 12px; margin: 0;">PikWizard</p>
</a>
</span>
</span>
Free (free of charge)
Free for personal and commercial use.
Author: Awesome Content
Similar Free Stock Images

Premium


Premium


Premium


Premium


Premium


Premium


Premium


Premium


Premium


Premium


Premium


Premium


Premium


Premium


Premium


Premium


Premium


Premium


Premium


Premium


Premium


Premium


Premium


Premium

