
- Home >
- Stock Photos >
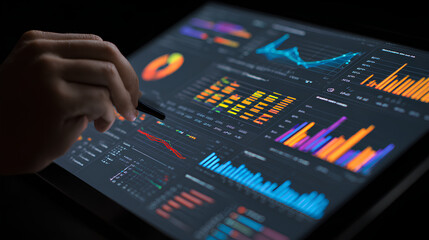
- High-Tech Data Analysis Interface with Graphs and Viewfinder
High-Tech Data Analysis Interface with Graphs and Viewfinder Image

Abstract depiction of a technological interface showing infographics and a viewfinder in a digital overlay. Suitable for illustrating concepts of big data, technology advancements, financial analysis, digital reports, and futuristic tech design in presentations, websites, or educational materials.
Powered by 


downloads
Tags:
More
Credit Photo
If you would like to credit the Photo, here are some ways you can do so
Text Link
photo Link
<span class="text-link">
<span>
<a target="_blank" href=https://pikwizard.com/photo/high-tech-data-analysis-interface-with-graphs-and-viewfinder/54d7a45355a6fadb0a3c318328f287eb/>PikWizard</a>
</span>
</span>
<span class="image-link">
<span
style="margin: 0 0 20px 0; display: inline-block; vertical-align: middle; width: 100%;"
>
<a
target="_blank"
href="https://pikwizard.com/photo/high-tech-data-analysis-interface-with-graphs-and-viewfinder/54d7a45355a6fadb0a3c318328f287eb/"
style="text-decoration: none; font-size: 10px; margin: 0;"
>
<img src="https://pikwizard.com/pw/medium/54d7a45355a6fadb0a3c318328f287eb.jpg" style="margin: 0; width: 100%;" alt="" />
<p style="font-size: 12px; margin: 0;">PikWizard</p>
</a>
</span>
</span>
Free (free of charge)
Free for personal and commercial use.
Author: Creative Art
Similar Free Stock Images

Premium


Premium


Premium

Premium

Premium


Premium


Premium


Premium


Premium


Premium


Premium


Premium


Premium


Premium


Premium


Premium


Premium


Premium


Premium


Premium


Premium


Premium


Premium

Premium


Premium


Explore More Free Stock Images