
- Home >
- Stock Photos >
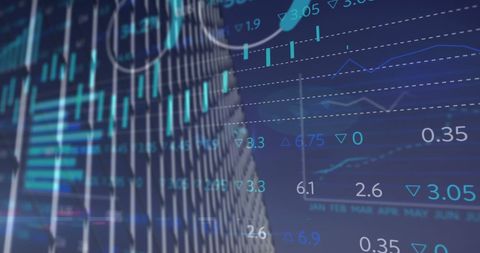
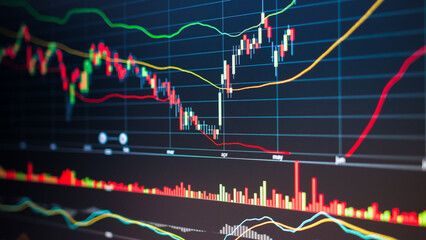
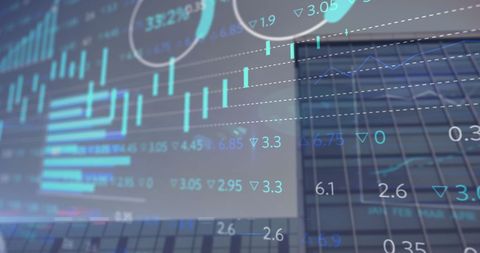
- High-Tech Data Analytics with Overlaid Virtual Charts
High-Tech Data Analytics with Overlaid Virtual Charts Image

Visual represents a concept of digital data analytics and processing within a modern technological environment. Striking combination of virtual charts superimposed over a server room highlights the blend of digital data and high-tech computing. Ideal for use in discussions about digital transformation, cloud computing solutions, business intelligence tools, and innovations in technology infrastructure.
Powered by 


downloads
Tags:
More
Credit Photo
If you would like to credit the Photo, here are some ways you can do so
Text Link
photo Link
<span class="text-link">
<span>
<a target="_blank" href=https://pikwizard.com/photo/high-tech-data-analytics-with-overlaid-virtual-charts/60c5e2dfd5253481d70a0375beb73b9e/>PikWizard</a>
</span>
</span>
<span class="image-link">
<span
style="margin: 0 0 20px 0; display: inline-block; vertical-align: middle; width: 100%;"
>
<a
target="_blank"
href="https://pikwizard.com/photo/high-tech-data-analytics-with-overlaid-virtual-charts/60c5e2dfd5253481d70a0375beb73b9e/"
style="text-decoration: none; font-size: 10px; margin: 0;"
>
<img src="https://pikwizard.com/pw/medium/60c5e2dfd5253481d70a0375beb73b9e.jpg" style="margin: 0; width: 100%;" alt="" />
<p style="font-size: 12px; margin: 0;">PikWizard</p>
</a>
</span>
</span>
Free (free of charge)
Free for personal and commercial use.
Author: Creative Art
Similar Free Stock Images
Premium


Premium


Premium


Premium


Premium

Premium

Premium


Premium

Premium


Premium


Premium

Premium


Premium
Premium

Premium


Premium


Premium


Premium


Premium


Premium

Premium


Premium


Premium


Premium


Premium

Explore More Free Stock Images