
- Home >
- Stock Photos >
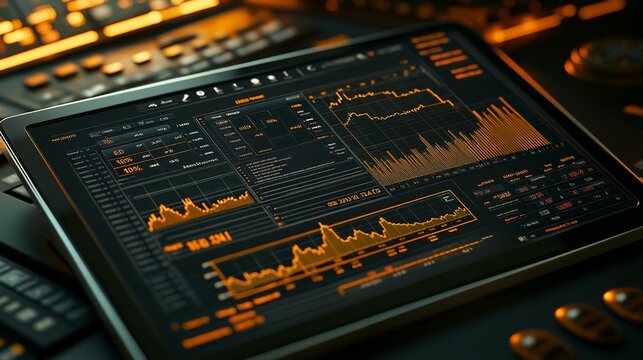
- High-Tech Digital Graph on Futuristic Interface Background
High-Tech Digital Graph on Futuristic Interface Background Image

Futuristic digital graph set against complex interface. Symbolizes data analysis and growth potential in digital economy. Ideal for presentations, financial market insights, or visualizing business success.
Powered by 


downloads
Tags:
More
Credit Photo
If you would like to credit the Photo, here are some ways you can do so
Text Link
photo Link
<span class="text-link">
<span>
<a target="_blank" href=https://pikwizard.com/photo/high-tech-digital-graph-on-futuristic-interface-background/56d5cb0b72b345abd47fcc805eb8b685/>PikWizard</a>
</span>
</span>
<span class="image-link">
<span
style="margin: 0 0 20px 0; display: inline-block; vertical-align: middle; width: 100%;"
>
<a
target="_blank"
href="https://pikwizard.com/photo/high-tech-digital-graph-on-futuristic-interface-background/56d5cb0b72b345abd47fcc805eb8b685/"
style="text-decoration: none; font-size: 10px; margin: 0;"
>
<img src="https://pikwizard.com/pw/medium/56d5cb0b72b345abd47fcc805eb8b685.jpg" style="margin: 0; width: 100%;" alt="" />
<p style="font-size: 12px; margin: 0;">PikWizard</p>
</a>
</span>
</span>
Free (free of charge)
Free for personal and commercial use.
Author: People Creations
Similar Free Stock Images

Premium


Premium


Premium

Premium

Premium


Premium


Premium


Premium

Premium

Premium

Premium


Premium

Premium


Premium


Premium

Premium

Premium


Premium

Premium


Premium


Premium


Premium


Premium


Premium


Premium

Explore More Free Stock Images