
- Home >
- Stock Photos >
- High-Tech Digital Radar Interface Monitoring Data Graphs
High-Tech Digital Radar Interface Monitoring Data Graphs Image
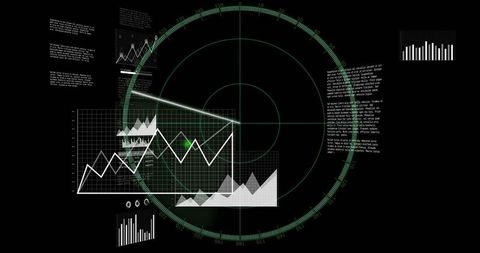
Features digital radar console with green sweeping grid displaying various data charts and analytics information. Useful for themes highlighting advanced technology, data management, financial analytics, digital dashboards, or futuristic interfaces in presentations, websites, or educational materials.
Powered by  - Get 15% off with code: PIKWIZARD15


0
downloads
downloads
Tags:
More
Credit Photo
If you would like to credit the Photo, here are some ways you can do so
Text Link
photo Link
<span class="text-link">
<span>
<a target="_blank" href=https://pikwizard.com/photo/high-tech-digital-radar-interface-monitoring-data-graphs/21cdad4a57e8cdbaf00889873c60cf06/>PikWizard</a>
</span>
</span>
<span class="image-link">
<span
style="margin: 0 0 20px 0; display: inline-block; vertical-align: middle; width: 100%;"
>
<a
target="_blank"
href="https://pikwizard.com/photo/high-tech-digital-radar-interface-monitoring-data-graphs/21cdad4a57e8cdbaf00889873c60cf06/"
style="text-decoration: none; font-size: 10px; margin: 0;"
>
<img src="https://pikwizard.com/pw/medium/21cdad4a57e8cdbaf00889873c60cf06.jpg" style="margin: 0; width: 100%;" alt="" />
<p style="font-size: 12px; margin: 0;">PikWizard</p>
</a>
</span>
</span>
Free (free of charge)
Free for personal and commercial use.
Author: People Creations