
- Home >
- Stock Photos >
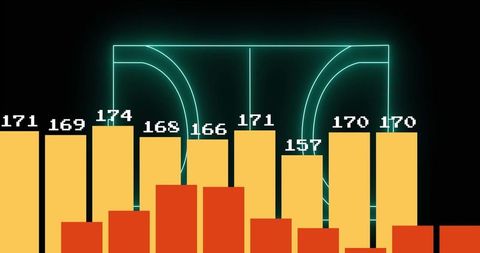
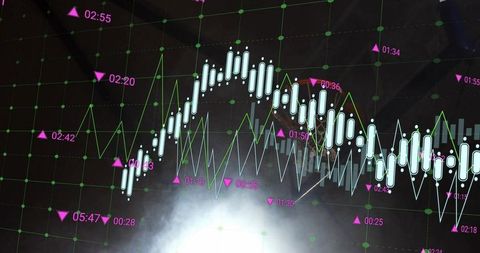
- High-Tech Financial Data Chart with 3D Bars and Graphs
High-Tech Financial Data Chart with 3D Bars and Graphs Image
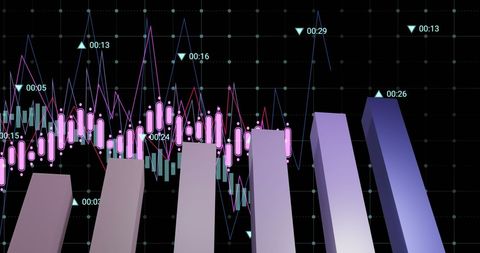
A digital depiction of financial data represented with 3D bars and overlaid graphical charts on a dark digital grid. Designed for illustrating financial market analysis, stock data interpretation, and technological advancement in data processing. Useful for financial reports, tech-themed presentations, or business analysis materials.
Powered by 


downloads
Tags:
More
Credit Photo
If you would like to credit the Photo, here are some ways you can do so
Text Link
photo Link
<span class="text-link">
<span>
<a target="_blank" href=https://pikwizard.com/photo/high-tech-financial-data-chart-with-3d-bars-and-graphs/bc8a2d5bf79050d985622dfb5576bd77/>PikWizard</a>
</span>
</span>
<span class="image-link">
<span
style="margin: 0 0 20px 0; display: inline-block; vertical-align: middle; width: 100%;"
>
<a
target="_blank"
href="https://pikwizard.com/photo/high-tech-financial-data-chart-with-3d-bars-and-graphs/bc8a2d5bf79050d985622dfb5576bd77/"
style="text-decoration: none; font-size: 10px; margin: 0;"
>
<img src="https://pikwizard.com/pw/medium/bc8a2d5bf79050d985622dfb5576bd77.jpg" style="margin: 0; width: 100%;" alt="" />
<p style="font-size: 12px; margin: 0;">PikWizard</p>
</a>
</span>
</span>
Free (free of charge)
Free for personal and commercial use.
Author: People Creations
Similar Free Stock Images

Premium


Premium

Premium


Premium


Premium


Premium


Premium


Premium

Premium


Premium


Premium


Premium


Premium


Premium


Premium


Premium


Premium


Premium


Premium


Premium


Premium

Premium


Premium

Premium


Premium


Explore More Free Stock Images