- Home >
- Stock Photos >
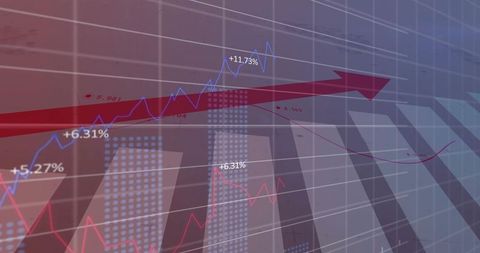
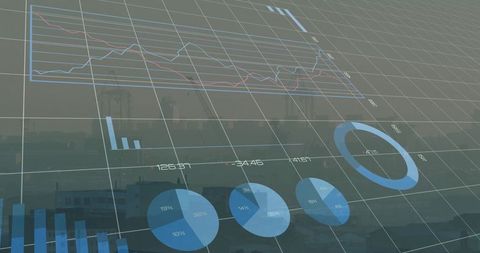
- High Tech Financial Data Visualization with Analytics
High Tech Financial Data Visualization with Analytics Image

Digital interface displaying complex financial data including charts and graphs against dark subdued colors. Suitable for illustrating topics related to financial technology, data processing, business analytics, and global market dynamics.

downloads
Tags:
More
Credit Photo
If you would like to credit the Photo, here are some ways you can do so
Text Link
photo Link
<span class="text-link">
<span>
<a target="_blank" href=https://pikwizard.com/photo/high-tech-financial-data-visualization-with-analytics/54333bf4e352ef8f911d18ed7bf7802c/>PikWizard</a>
</span>
</span>
<span class="image-link">
<span
style="margin: 0 0 20px 0; display: inline-block; vertical-align: middle; width: 100%;"
>
<a
target="_blank"
href="https://pikwizard.com/photo/high-tech-financial-data-visualization-with-analytics/54333bf4e352ef8f911d18ed7bf7802c/"
style="text-decoration: none; font-size: 10px; margin: 0;"
>
<img src="https://pikwizard.com/pw/medium/54333bf4e352ef8f911d18ed7bf7802c.jpg" style="margin: 0; width: 100%;" alt="" />
<p style="font-size: 12px; margin: 0;">PikWizard</p>
</a>
</span>
</span>
Free (free of charge)
Free for personal and commercial use.
Author: Creative Art