
- Home >
- Stock Photos >
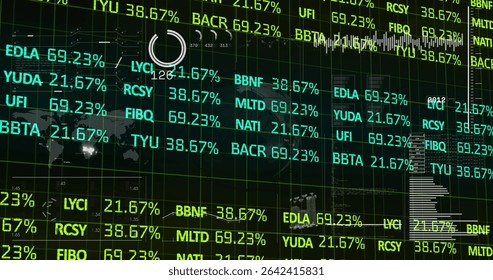
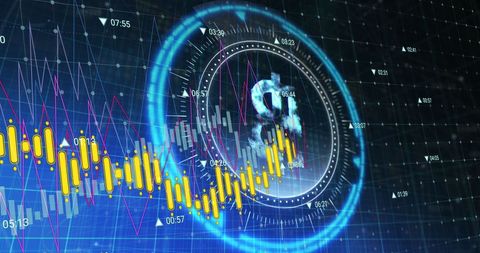
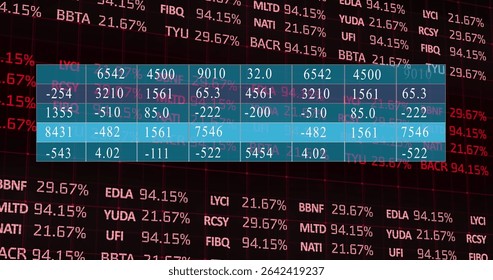
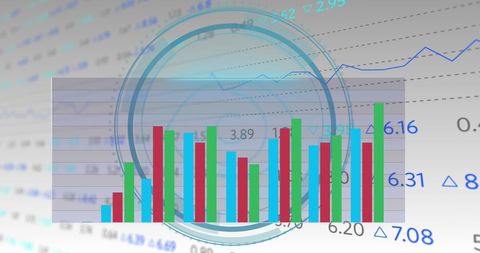
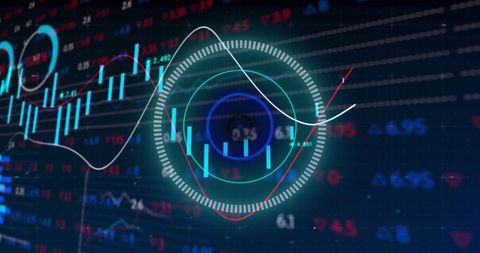
- High-Tech Financial Data Visualization with Holographic Elements
High-Tech Financial Data Visualization with Holographic Elements Image

Provides futuristic representation of financial data processing. Useful for illustrating tech-centered financial articles, economic analysis, and presentations on digital innovations in finance. Suitable for design projects that focus on tech impact on global business.
Powered by  - Get 15% off with code: PIKWIZARD15


downloads
Tags:
More
Credit Photo
If you would like to credit the Photo, here are some ways you can do so
Text Link
photo Link
<span class="text-link">
<span>
<a target="_blank" href=https://pikwizard.com/photo/high-tech-financial-data-visualization-with-holographic-elements/c7ccdfb160411ca421e7ac33cf9414b2/>PikWizard</a>
</span>
</span>
<span class="image-link">
<span
style="margin: 0 0 20px 0; display: inline-block; vertical-align: middle; width: 100%;"
>
<a
target="_blank"
href="https://pikwizard.com/photo/high-tech-financial-data-visualization-with-holographic-elements/c7ccdfb160411ca421e7ac33cf9414b2/"
style="text-decoration: none; font-size: 10px; margin: 0;"
>
<img src="https://pikwizard.com/pw/medium/c7ccdfb160411ca421e7ac33cf9414b2.jpg" style="margin: 0; width: 100%;" alt="" />
<p style="font-size: 12px; margin: 0;">PikWizard</p>
</a>
</span>
</span>
Free (free of charge)
Free for personal and commercial use.
Author: Creative Art
Similar Free Stock Images

Premium

Premium

Premium


Premium


Premium


Premium

Premium


Premium


Premium


Premium

Premium


Premium

Premium


Premium


Premium


Premium


Premium


Premium


Premium


Premium

Premium


Premium


Premium


Premium


Premium
Explore More Free Stock Images