
- Home >
- Stock Photos >
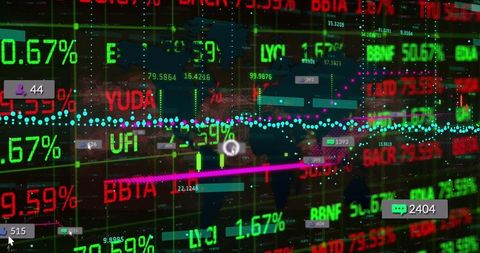
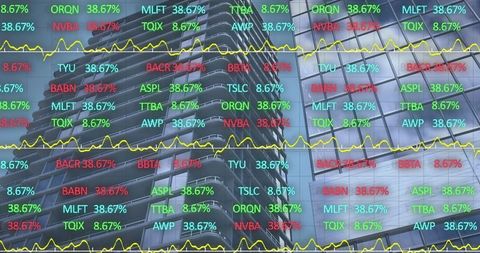
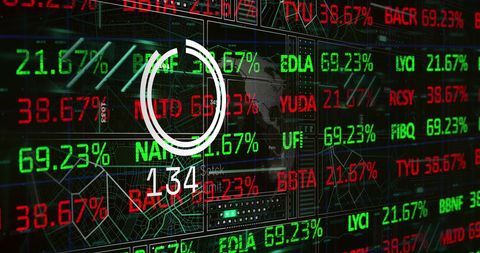
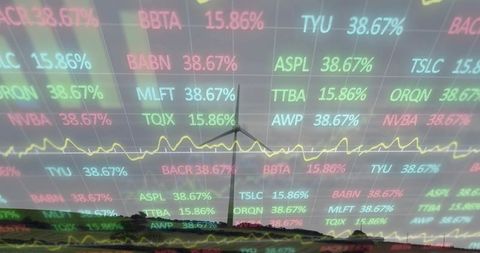
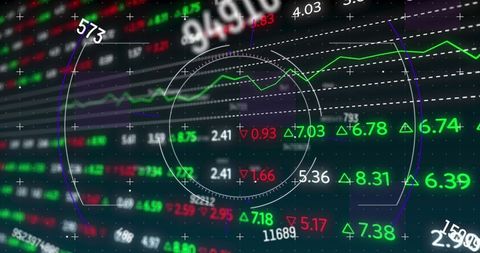
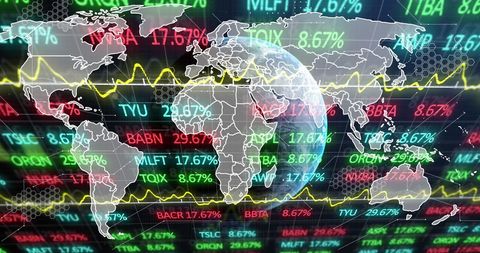
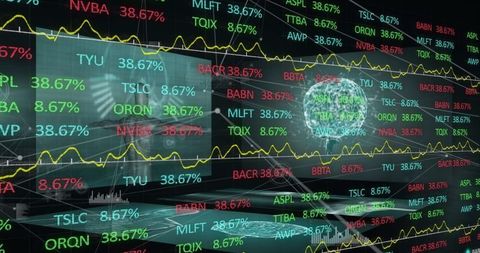
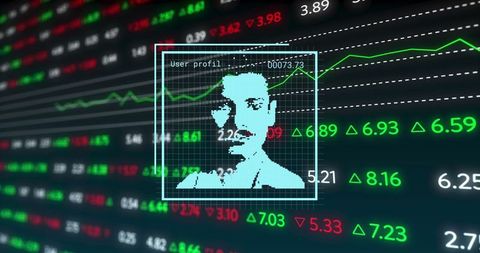
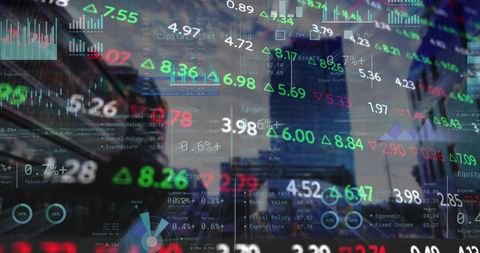
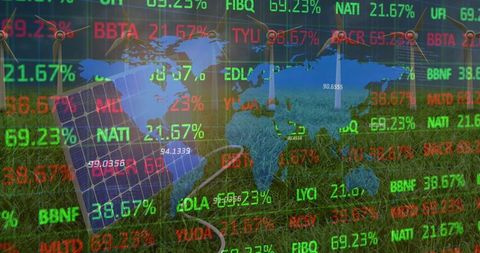
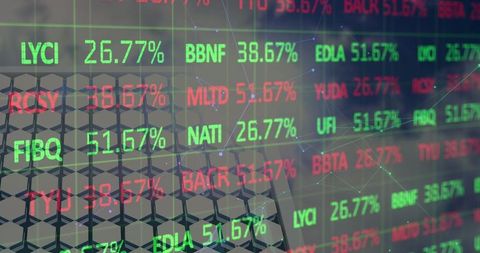
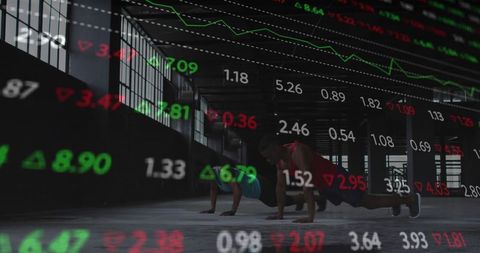
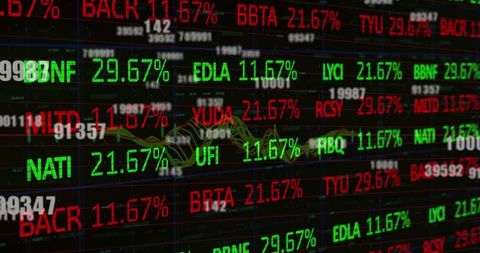
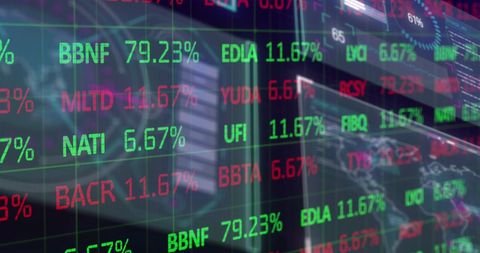
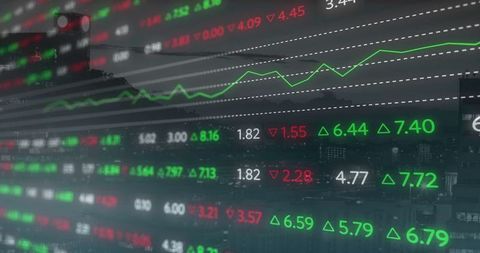
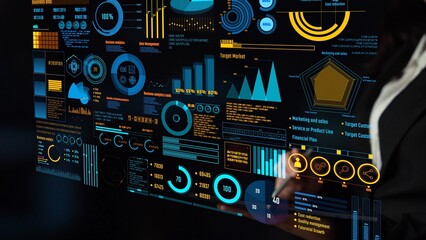
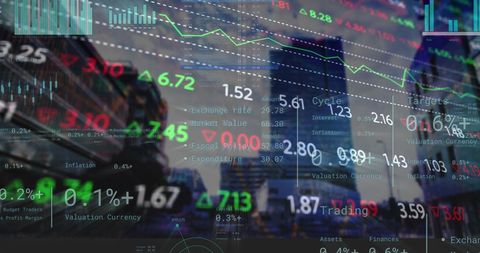
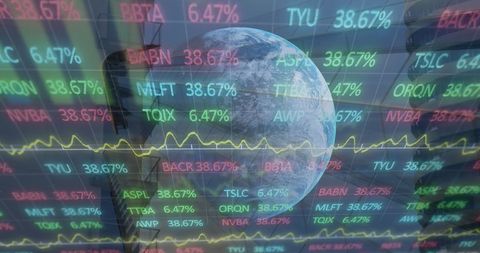
- High-Tech Financial Market Interface with Floating Data and Analytics
High-Tech Financial Market Interface with Floating Data and Analytics Image
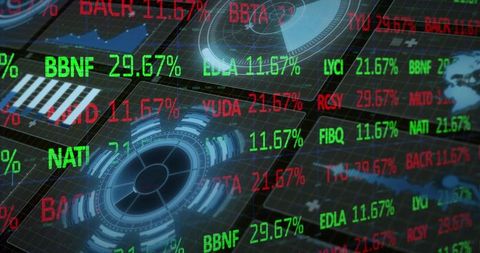
The image showcases an advanced trading interface enriched with vibrant red and green data displays across a digital dashboard. It includes items like floating tickers and charts against a dark grid, utilizing themes of technology and finance. Great for illustrating financial market dynamics, technology-driven trading and data visualization themes in content ranging from blog posts to informative presentations.
Powered by 


downloads
Tags:
More
Credit Photo
If you would like to credit the Photo, here are some ways you can do so
Text Link
photo Link
<span class="text-link">
<span>
<a target="_blank" href=https://pikwizard.com/photo/high-tech-financial-market-interface-with-floating-data-and-analytics/d4310081b63eb765232004d28e7bab4f/>PikWizard</a>
</span>
</span>
<span class="image-link">
<span
style="margin: 0 0 20px 0; display: inline-block; vertical-align: middle; width: 100%;"
>
<a
target="_blank"
href="https://pikwizard.com/photo/high-tech-financial-market-interface-with-floating-data-and-analytics/d4310081b63eb765232004d28e7bab4f/"
style="text-decoration: none; font-size: 10px; margin: 0;"
>
<img src="https://pikwizard.com/pw/medium/d4310081b63eb765232004d28e7bab4f.jpg" style="margin: 0; width: 100%;" alt="" />
<p style="font-size: 12px; margin: 0;">PikWizard</p>
</a>
</span>
</span>
Free (free of charge)
Free for personal and commercial use.
Author: Creative Art
Similar Free Stock Images
Premium

Premium


Premium


Premium

Premium


Premium

Premium


Premium


Premium

Premium


Premium

Premium


Premium


Premium

Premium


Premium

Premium


Premium


Premium


Premium


Premium
Premium

Premium


Premium

Premium


Explore More Free Stock Images