
- Home >
- Stock Photos >
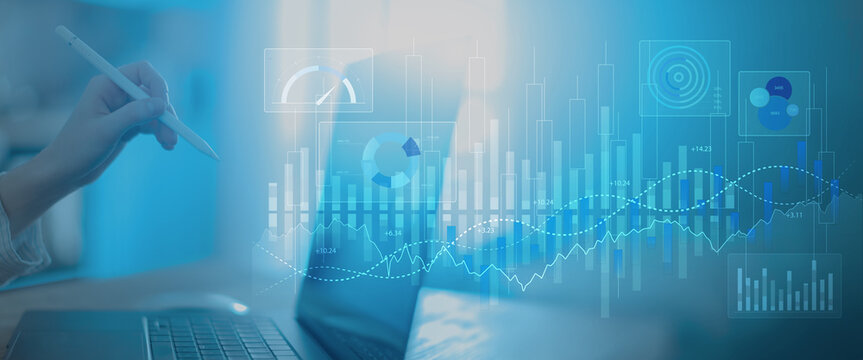
- High-tech Financial Trading Dashboard Display with Data Analysis
High-tech Financial Trading Dashboard Display with Data Analysis Image

Showcases trading dashboard brimming with data through grid, line, and candlestick charts accompanied by percentages and tickers. Enable enhanced understanding of financial analytics and presenting real-time market figures for investors, traders or financial tutorials. Ideal for articles on financial tech, educational content or presentations about digital information systems.
Powered by 


downloads
Tags:
More
Credit Photo
If you would like to credit the Photo, here are some ways you can do so
Text Link
photo Link
<span class="text-link">
<span>
<a target="_blank" href=https://pikwizard.com/photo/high-tech-financial-trading-dashboard-display-with-data-analysis/cf796ce5ccd3602d48e76c5f26e57ea5/>PikWizard</a>
</span>
</span>
<span class="image-link">
<span
style="margin: 0 0 20px 0; display: inline-block; vertical-align: middle; width: 100%;"
>
<a
target="_blank"
href="https://pikwizard.com/photo/high-tech-financial-trading-dashboard-display-with-data-analysis/cf796ce5ccd3602d48e76c5f26e57ea5/"
style="text-decoration: none; font-size: 10px; margin: 0;"
>
<img src="https://pikwizard.com/pw/medium/cf796ce5ccd3602d48e76c5f26e57ea5.jpg" style="margin: 0; width: 100%;" alt="" />
<p style="font-size: 12px; margin: 0;">PikWizard</p>
</a>
</span>
</span>
Free (free of charge)
Free for personal and commercial use.
Author: Awesome Content