
- Home >
- Stock Photos >
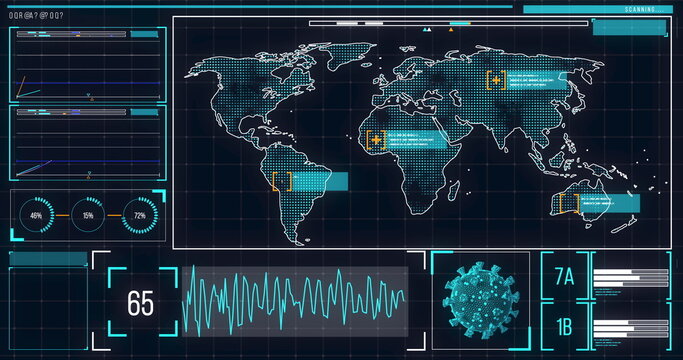
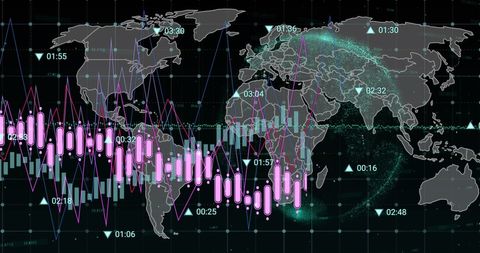
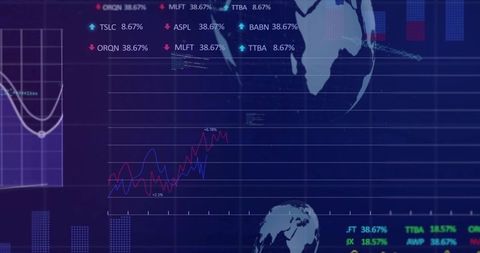
- High-Tech Global Map with COVID-19 Data Analysis
High-Tech Global Map with COVID-19 Data Analysis Image

Digital display showing world map with COVID-19 data and analytics, presenting graphs and numerical information. Useful for illustrating global health, pandemics, and analytical technology in presentations or educational materials.
Powered by 


downloads
Tags:
More
Credit Photo
If you would like to credit the Photo, here are some ways you can do so
Text Link
photo Link
<span class="text-link">
<span>
<a target="_blank" href=https://pikwizard.com/photo/high-tech-global-map-with-covid-19-data-analysis/1567b88ded1df17abdef89f348cc634a/>PikWizard</a>
</span>
</span>
<span class="image-link">
<span
style="margin: 0 0 20px 0; display: inline-block; vertical-align: middle; width: 100%;"
>
<a
target="_blank"
href="https://pikwizard.com/photo/high-tech-global-map-with-covid-19-data-analysis/1567b88ded1df17abdef89f348cc634a/"
style="text-decoration: none; font-size: 10px; margin: 0;"
>
<img src="https://pikwizard.com/pw/medium/1567b88ded1df17abdef89f348cc634a.jpg" style="margin: 0; width: 100%;" alt="" />
<p style="font-size: 12px; margin: 0;">PikWizard</p>
</a>
</span>
</span>
Free (free of charge)
Free for personal and commercial use.
Author: Creative Art
Similar Free Stock Images

Premium


Premium


Premium


Premium


Premium


Premium


Premium

Premium

Premium


Premium


Premium


Premium


Premium


Premium


Premium


Premium


Premium


Premium


Premium


Premium


Premium


Premium


Premium


Premium


Premium


Explore More Free Stock Images