- Home >
- Stock Photos >
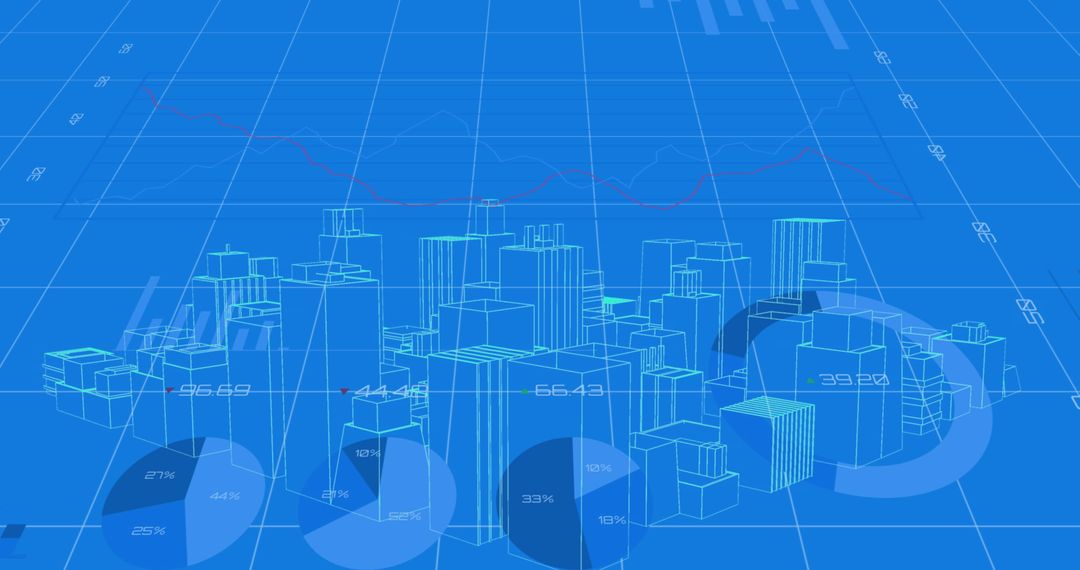
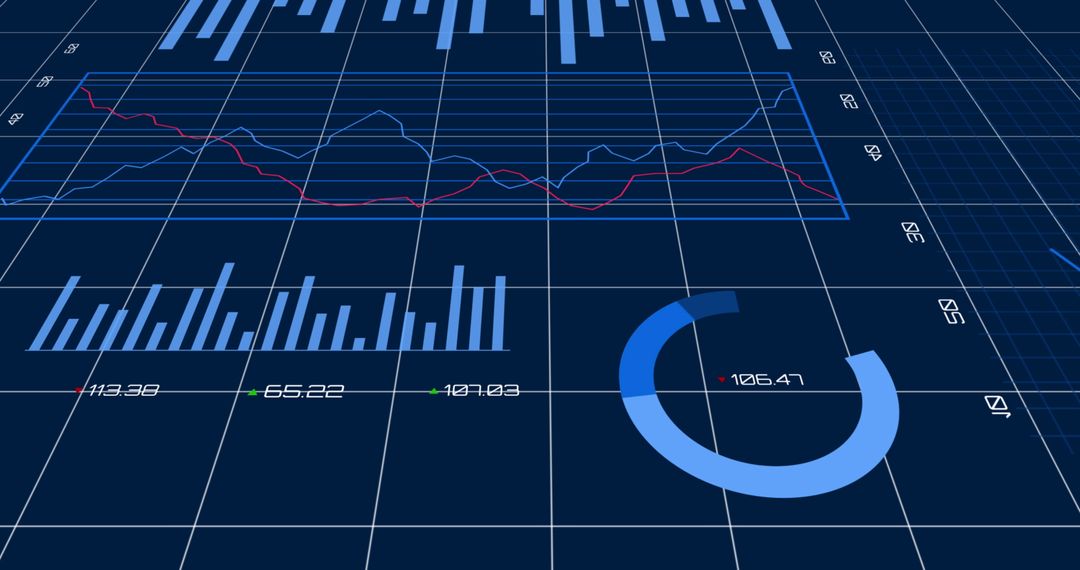
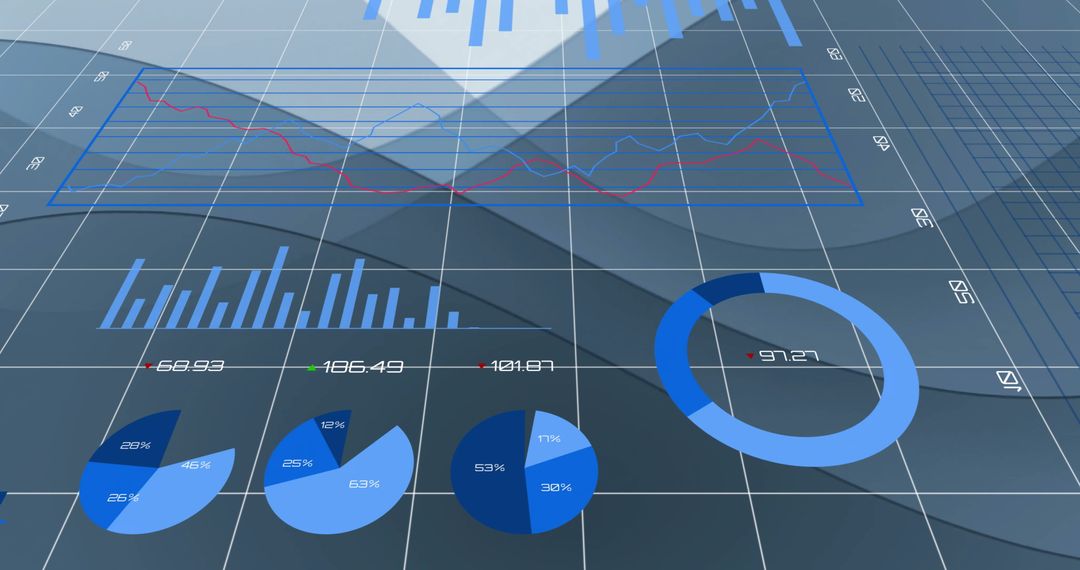
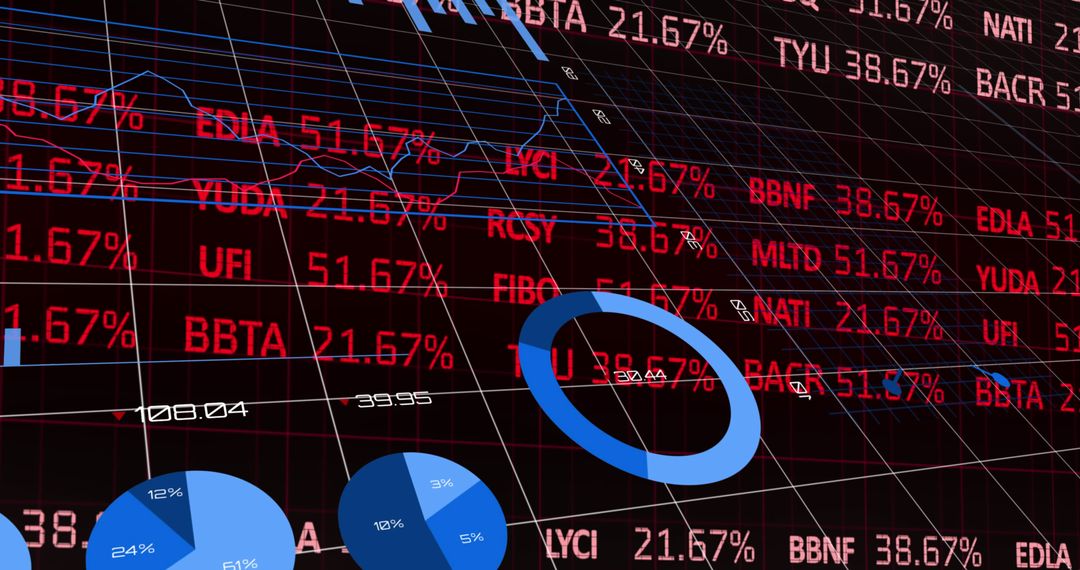
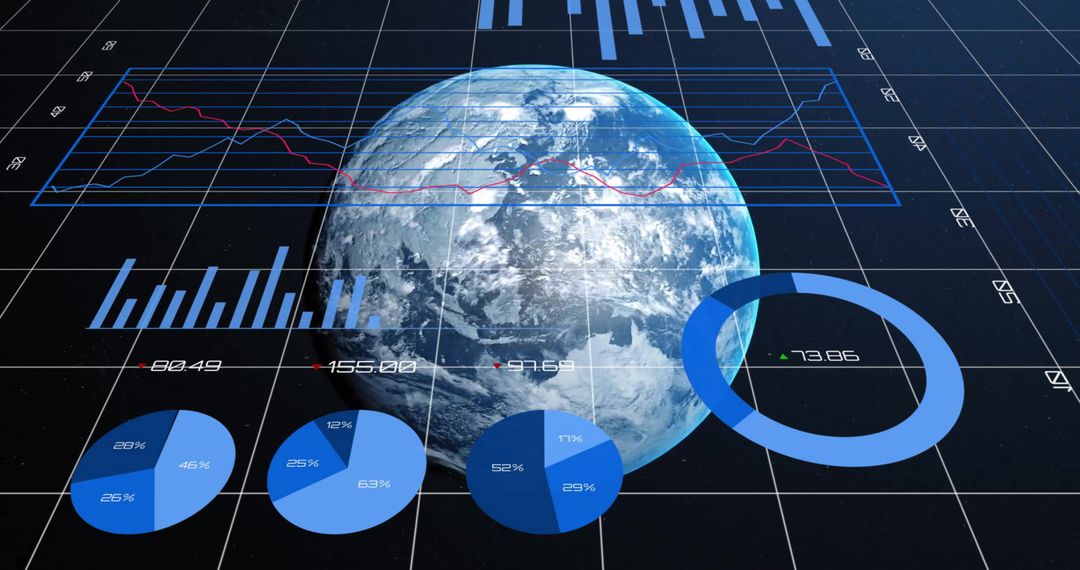
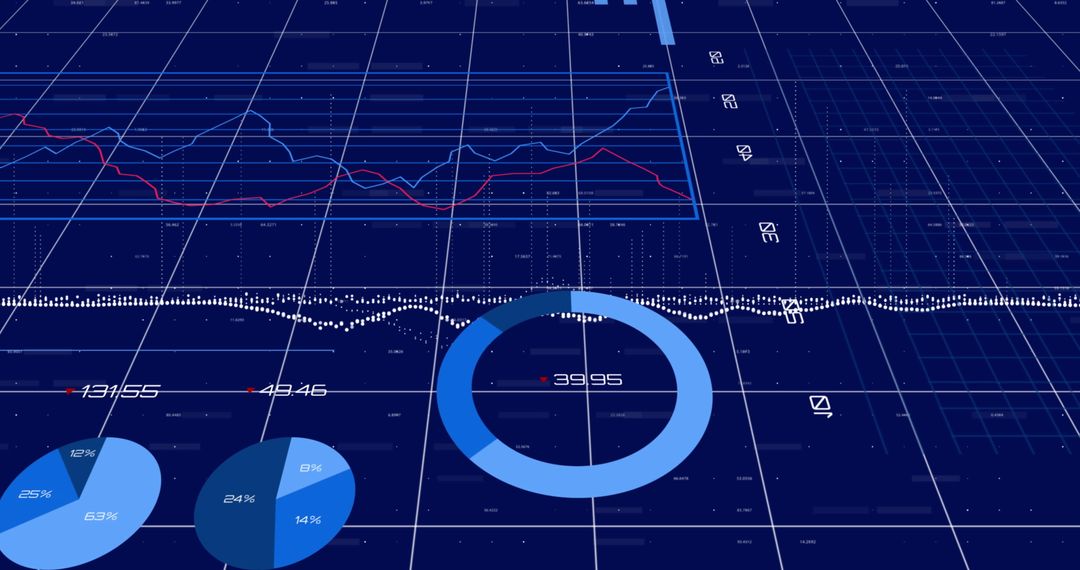
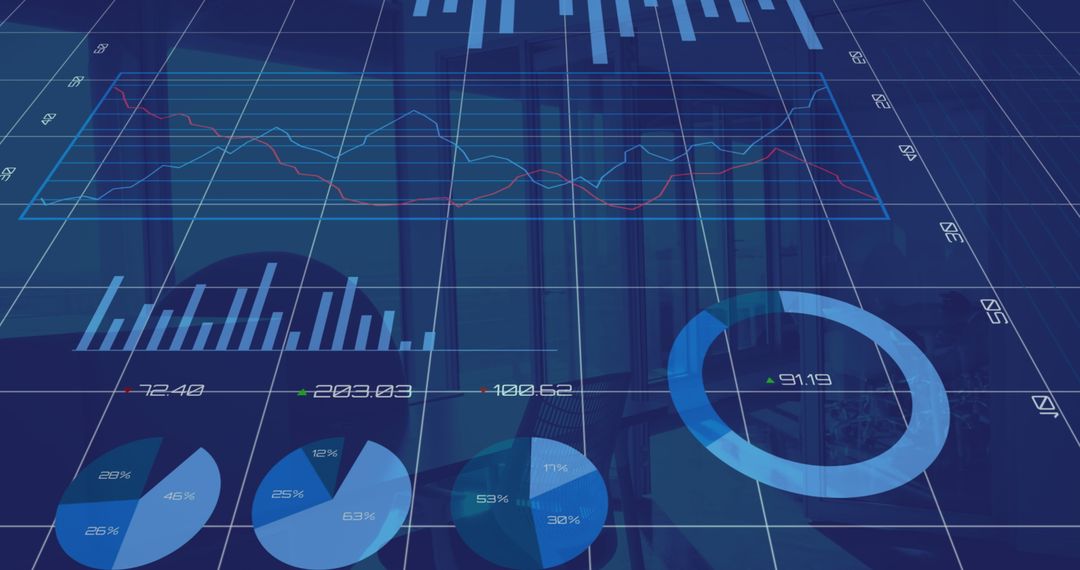
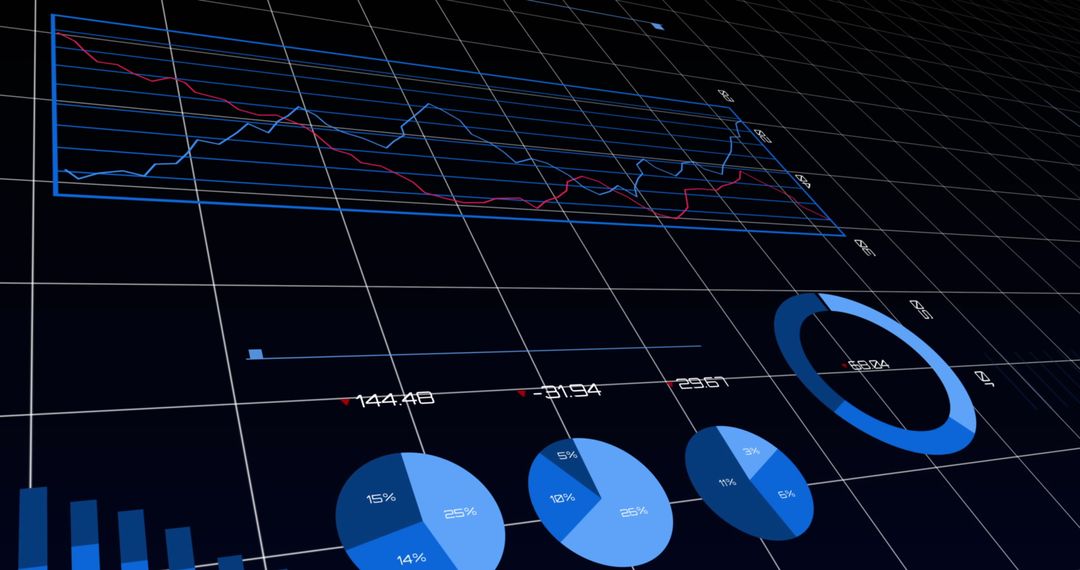
- Holographic 3D Blue Donut Chart Highlighting Segment on Navy Grid Data Dashboard
Holographic 3D Blue Donut Chart Highlighting Segment on Navy Grid Data Dashboard Image

Vivid holographic 3D analytics display featuring dominant blue donut chart highlighting single segment on navy grid plane. Complementary pie charts, line graphs, and glowing icons adding depth and visual hierarchy. Diagonal perspective creating dynamic sense of movement and modern tech mood. Suiting dashboard mockups, web banners, business reports, investor presentations, fintech landing pages, and data science blog headers. Suiting marketing materials, UX concepts, corporate data briefs, and conference slides. Editable for overlaying custom metrics, logos, or brand color palettes. High contrast palette ensuring readability on screens and print. Ideal for topics such as analytics, business intelligence, financial performance, IoT monitoring, sustainability metrics, and AI insights.
Powered by  - Get 15% off with code: PIKWIZARD15


0
downloads
downloads
Tags:
More
Credit Photo
If you would like to credit the Photo, here are some ways you can do so
Text Link
photo Link
<span class="text-link">
<span>
<a target="_blank" href=https://pikwizard.com/photo/holographic-3d-blue-donut-chart-highlighting-segment-on-navy-grid-data-dashboard/7c88f231bb72b61059ec996128548698/>PikWizard</a>
</span>
</span>
<span class="image-link">
<span
style="margin: 0 0 20px 0; display: inline-block; vertical-align: middle; width: 100%;"
>
<a
target="_blank"
href="https://pikwizard.com/photo/holographic-3d-blue-donut-chart-highlighting-segment-on-navy-grid-data-dashboard/7c88f231bb72b61059ec996128548698/"
style="text-decoration: none; font-size: 10px; margin: 0;"
>
<img src="https://pikwizard.com/pw/medium/7c88f231bb72b61059ec996128548698.jpg" style="margin: 0; width: 100%;" alt="" />
<p style="font-size: 12px; margin: 0;">PikWizard</p>
</a>
</span>
</span>
Free (free of charge)
Free for personal and commercial use.
Author: People Creations
Similar Free Stock Images

Premium


Premium


Premium


Premium


Premium


Premium


Premium


Premium


Premium


Premium


Premium


Premium


Premium


Premium


Premium


Premium


Premium


Premium


Premium


Premium


Premium


Premium


Premium


Premium