- Home >
- Stock Photos >
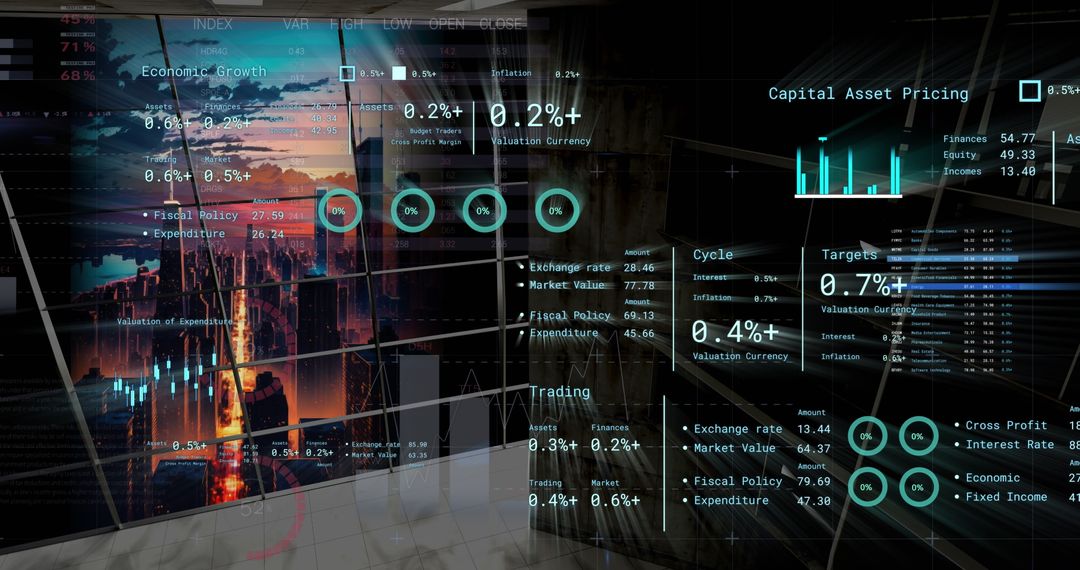
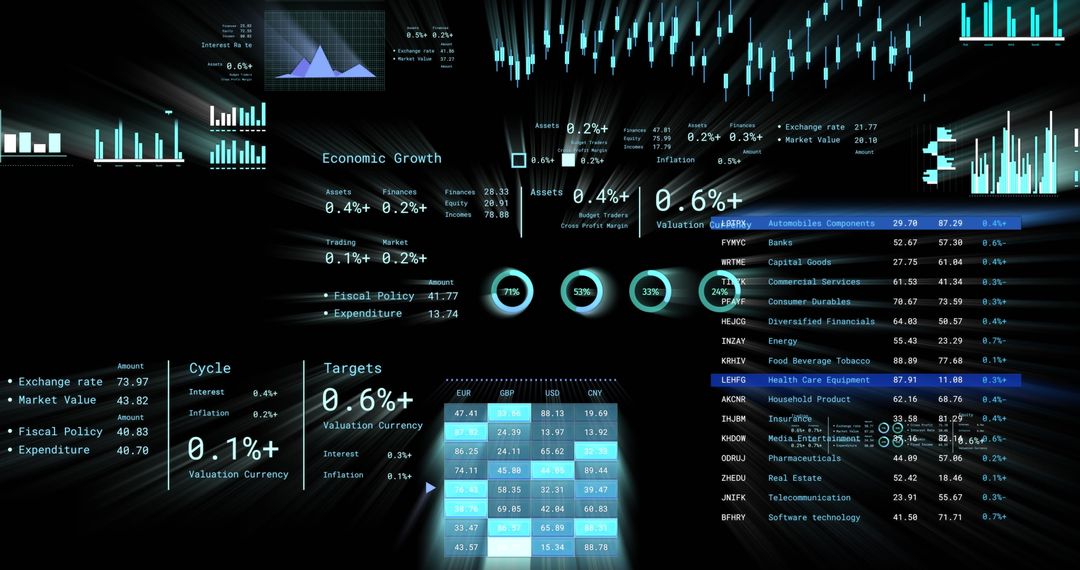
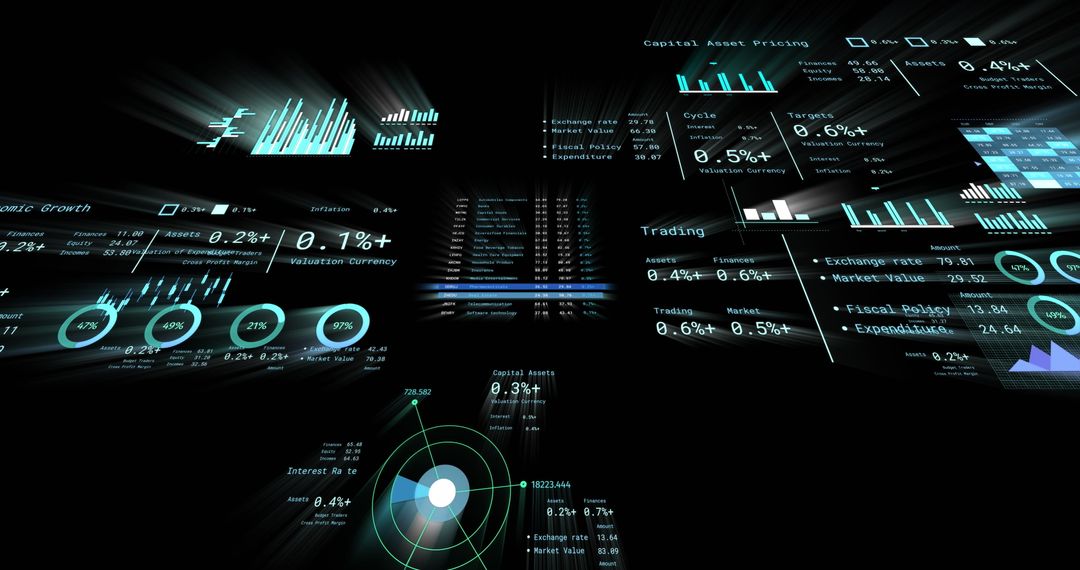
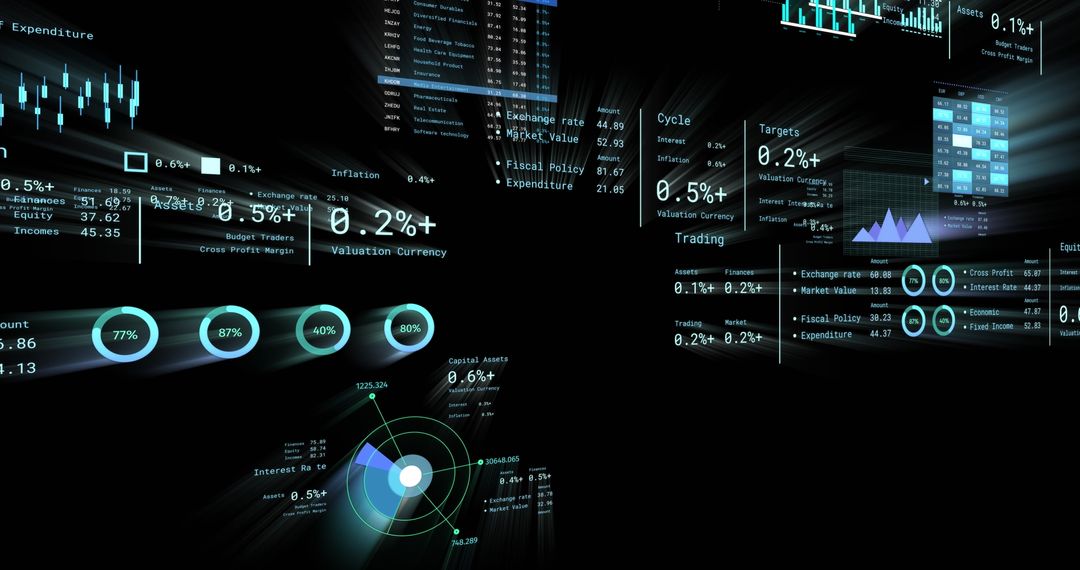
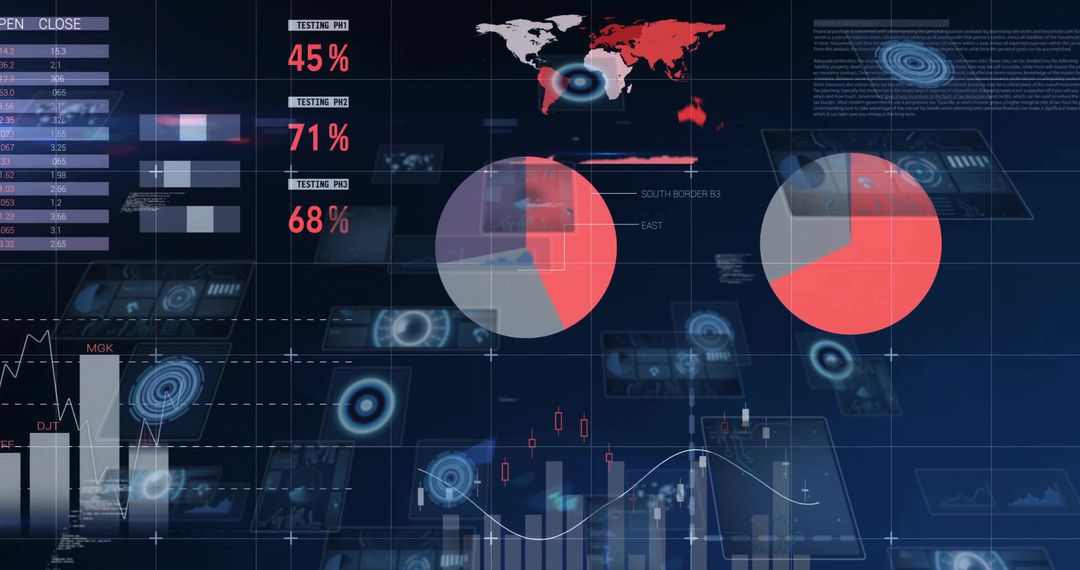
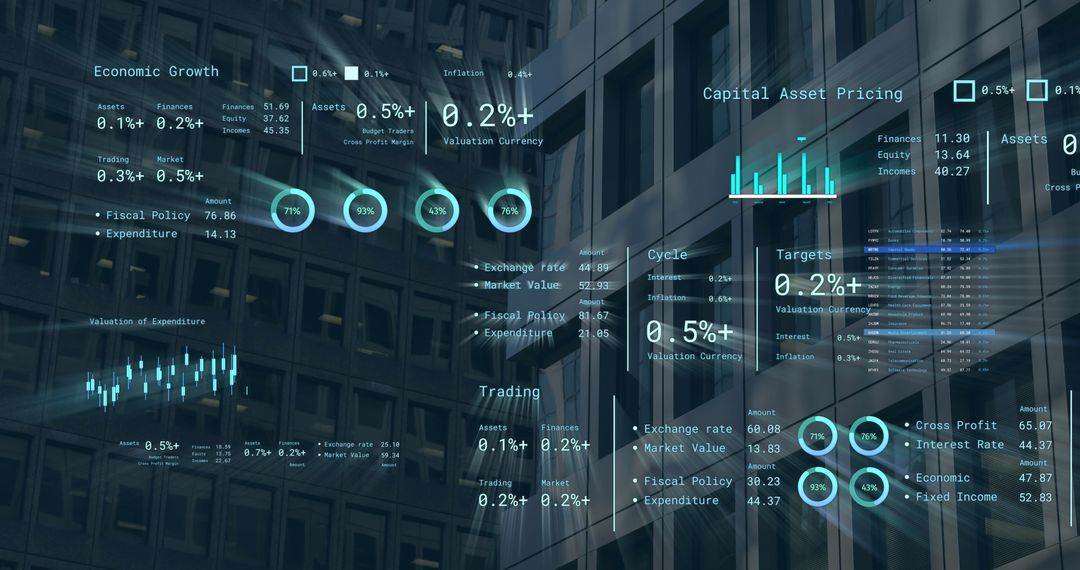
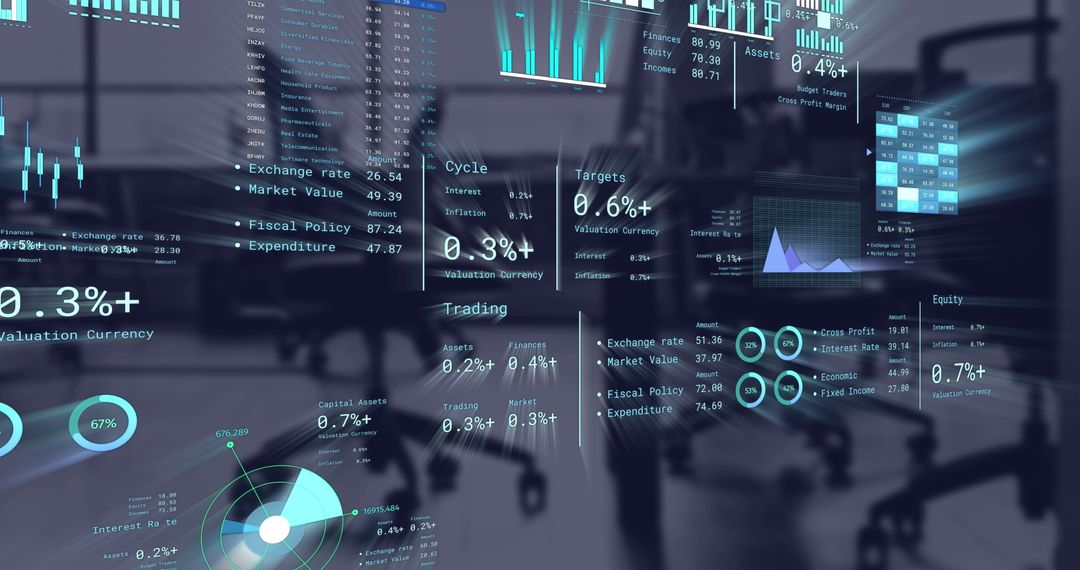
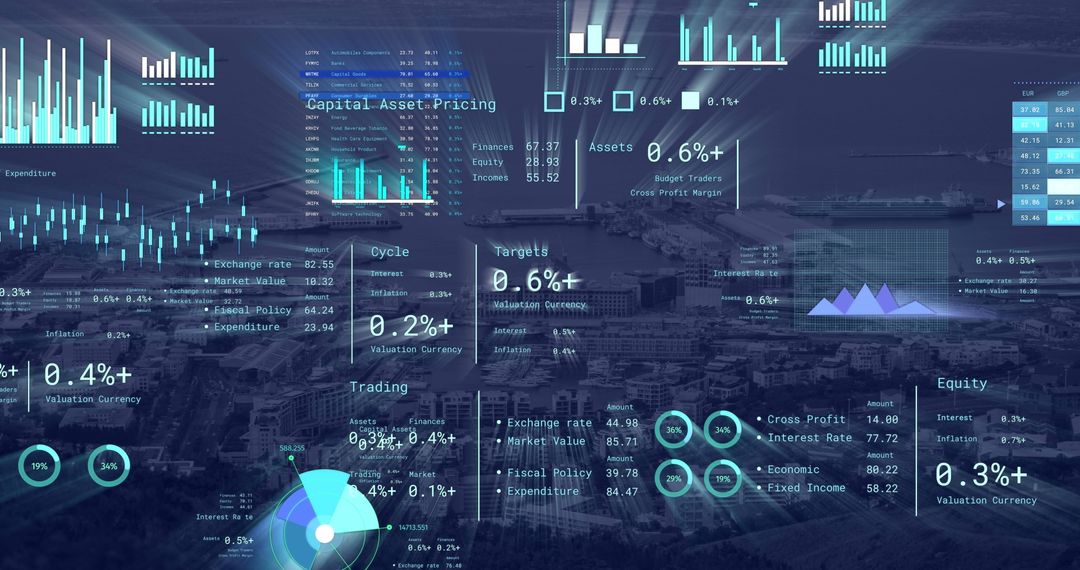
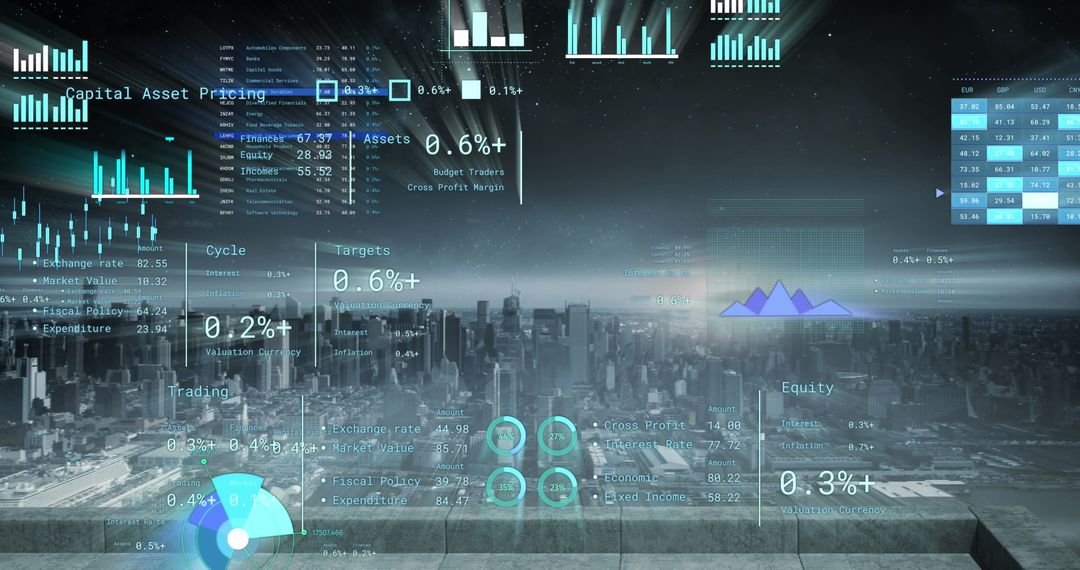
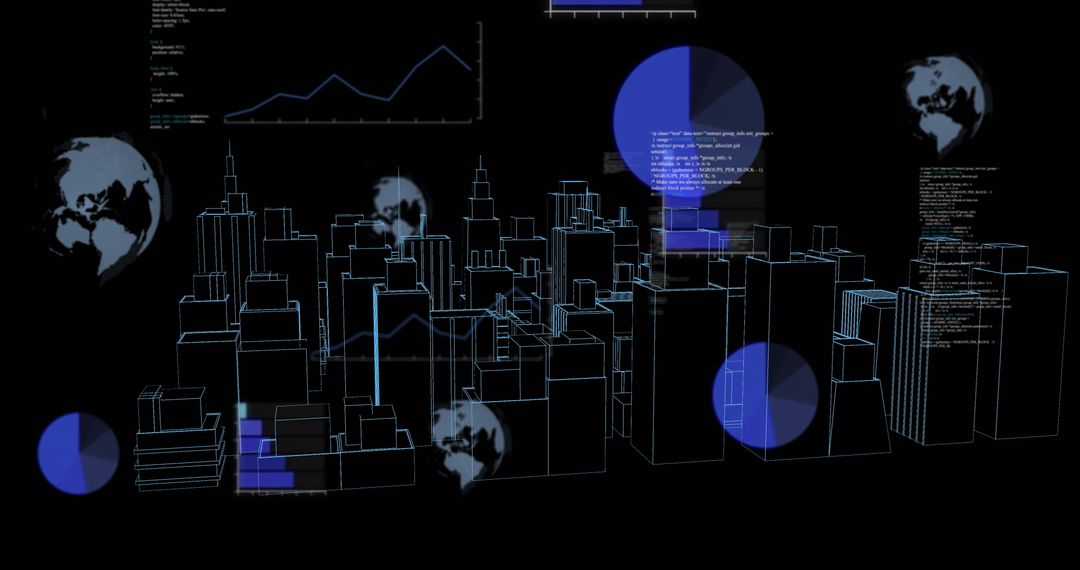
- Holographic 3D Data City Visualization with Neon Bar Charts and Financial Dashboards
Holographic 3D Data City Visualization with Neon Bar Charts and Financial Dashboards Image

Featuring holographic 3D block clusters floating in virtual space, showcasing layered bar charts, circular gauges, and line graphs. Using neon cyan and teal palette for high-tech, futuristic mood. Providing clear visual focus for analytics, fintech, AI, and blockchain topics. Ideal for header backgrounds, presentation slides, product demos, website banners, and social media campaigns highlighting performance metrics. Working well with motion graphics, AR overlays, and UI mockups to illustrate KPI dashboards, investor reports, market forecasts, and big data platforms.
Powered by  - Get 15% off with code: PIKWIZARD15


0
downloads
downloads
Tags:
More
Credit Photo
If you would like to credit the Photo, here are some ways you can do so
Text Link
photo Link
<span class="text-link">
<span>
<a target="_blank" href=https://pikwizard.com/photo/holographic-3d-data-city-visualization-with-neon-bar-charts-and-financial-dashboards/5a86583cc9b87e7b8484efaf3e6d73db/>PikWizard</a>
</span>
</span>
<span class="image-link">
<span
style="margin: 0 0 20px 0; display: inline-block; vertical-align: middle; width: 100%;"
>
<a
target="_blank"
href="https://pikwizard.com/photo/holographic-3d-data-city-visualization-with-neon-bar-charts-and-financial-dashboards/5a86583cc9b87e7b8484efaf3e6d73db/"
style="text-decoration: none; font-size: 10px; margin: 0;"
>
<img src="https://pikwizard.com/pw/medium/5a86583cc9b87e7b8484efaf3e6d73db.jpg" style="margin: 0; width: 100%;" alt="" />
<p style="font-size: 12px; margin: 0;">PikWizard</p>
</a>
</span>
</span>
Free (free of charge)
Free for personal and commercial use.
Author: People Creations
Similar Free Stock Images

Premium


Premium


Premium


Premium


Premium


Premium


Premium


Premium

Premium


Premium


Premium


Premium


Premium


Premium


Premium


Premium


Premium


Premium


Premium

Premium


Premium


Premium


Premium


Premium