- Home >
- Stock Photos >
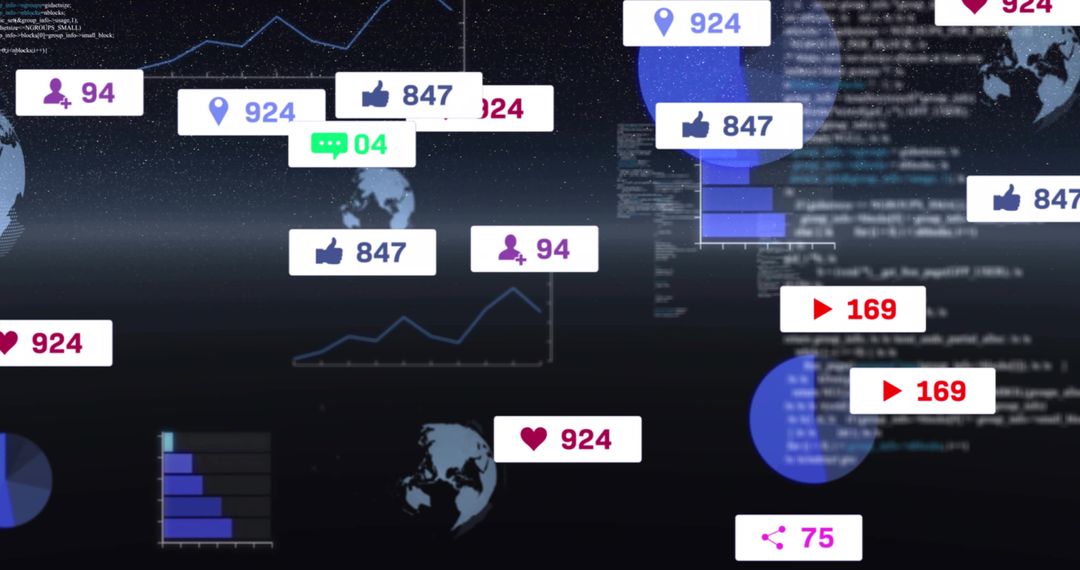
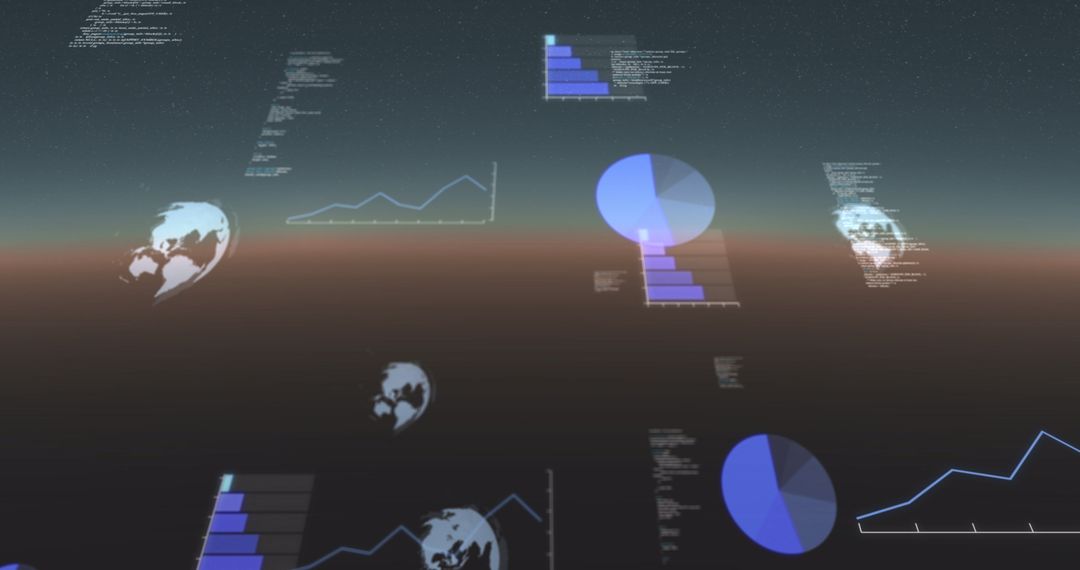
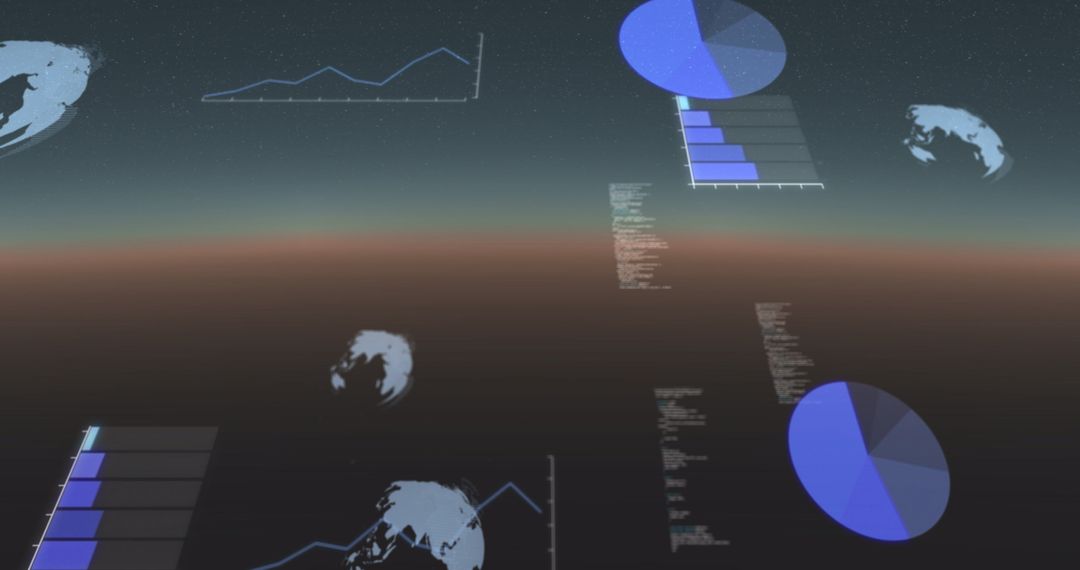
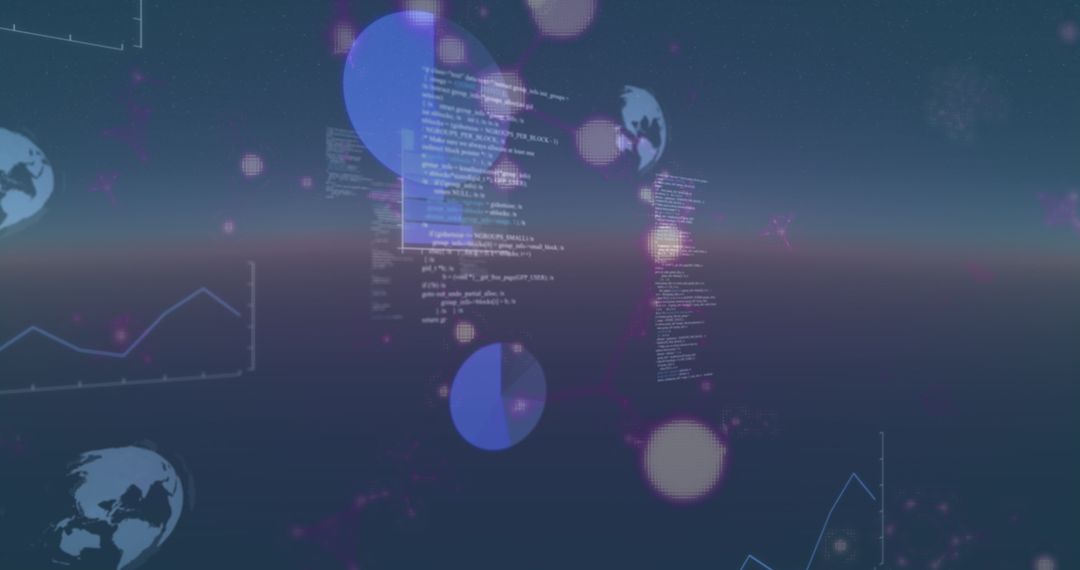
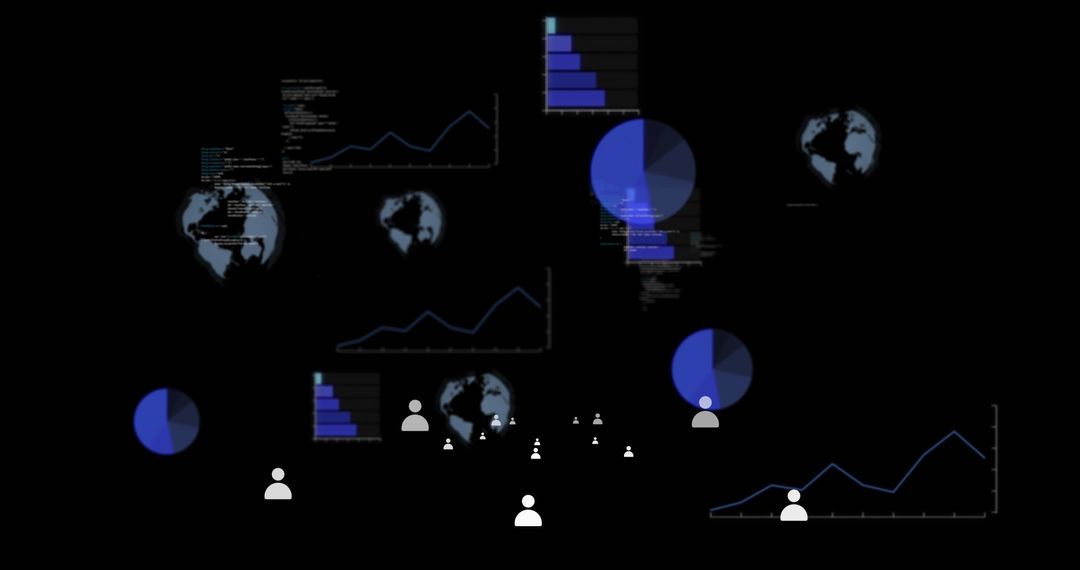
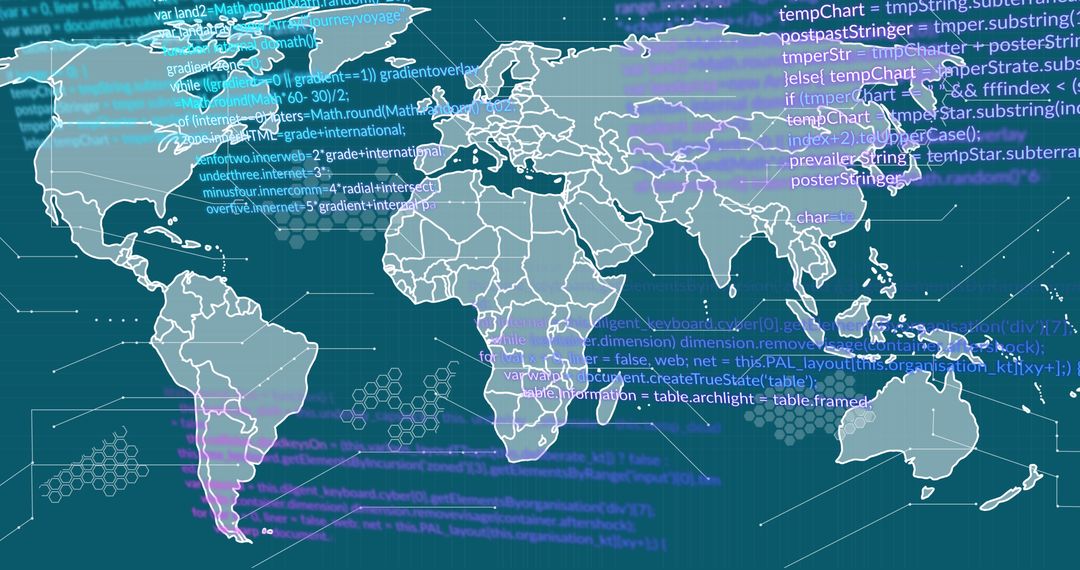
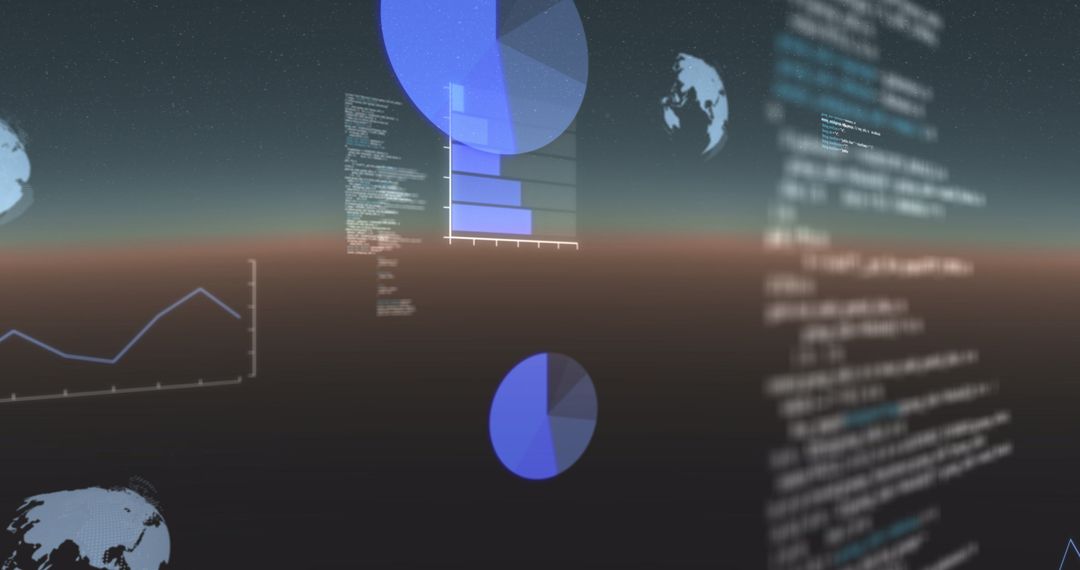
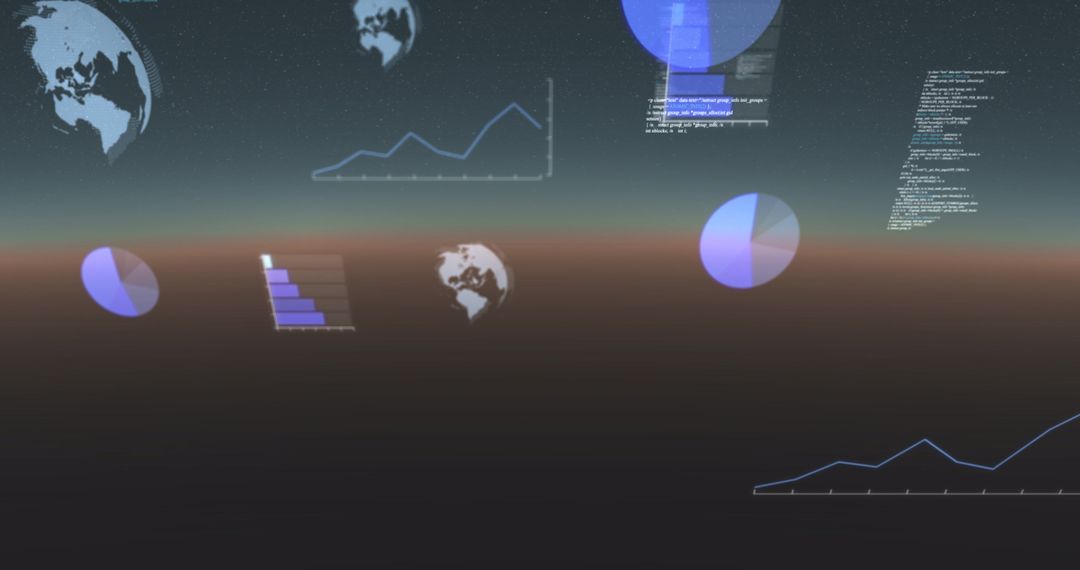
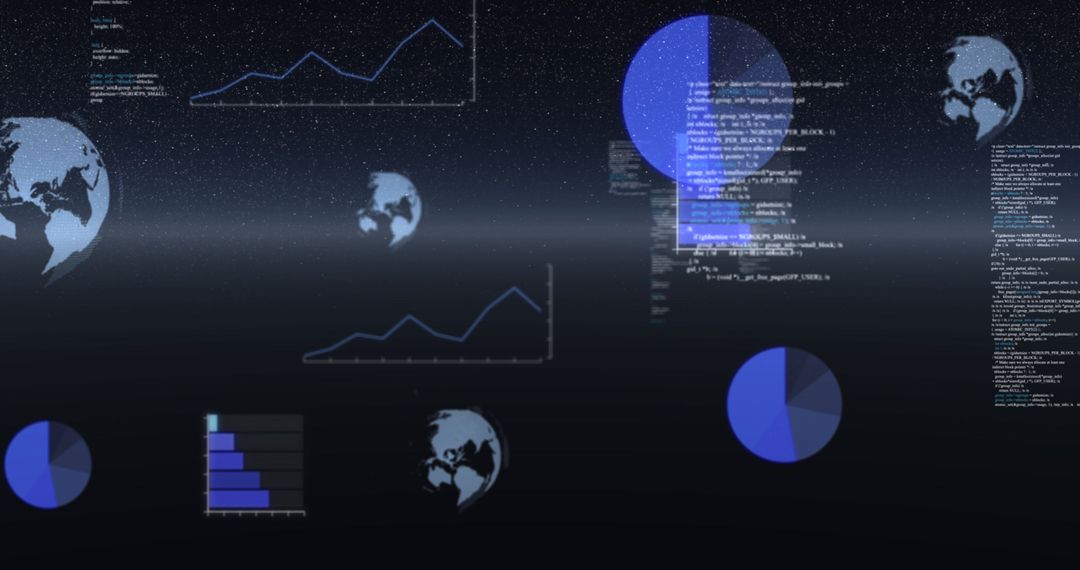
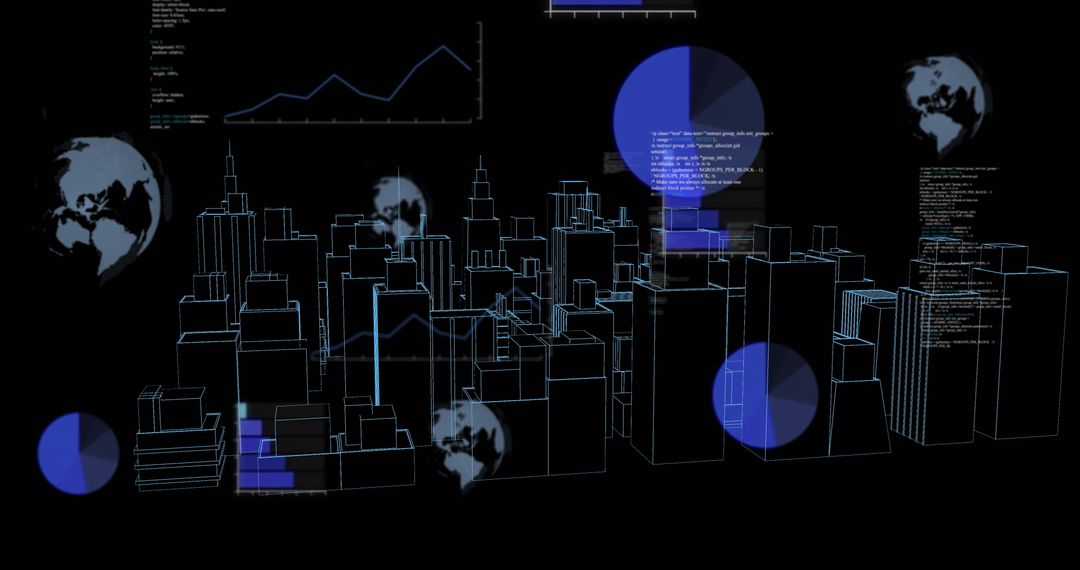
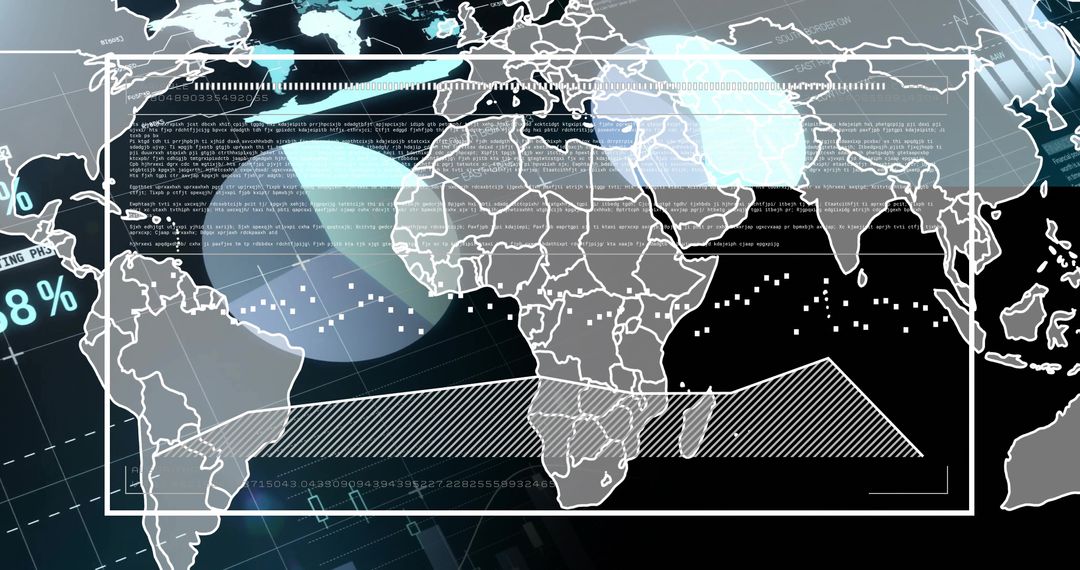
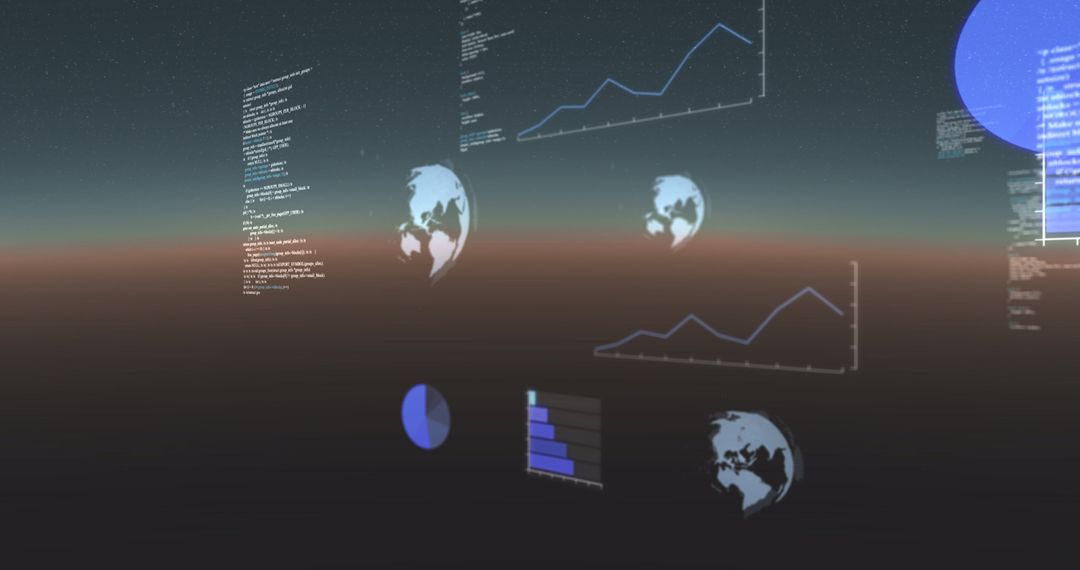
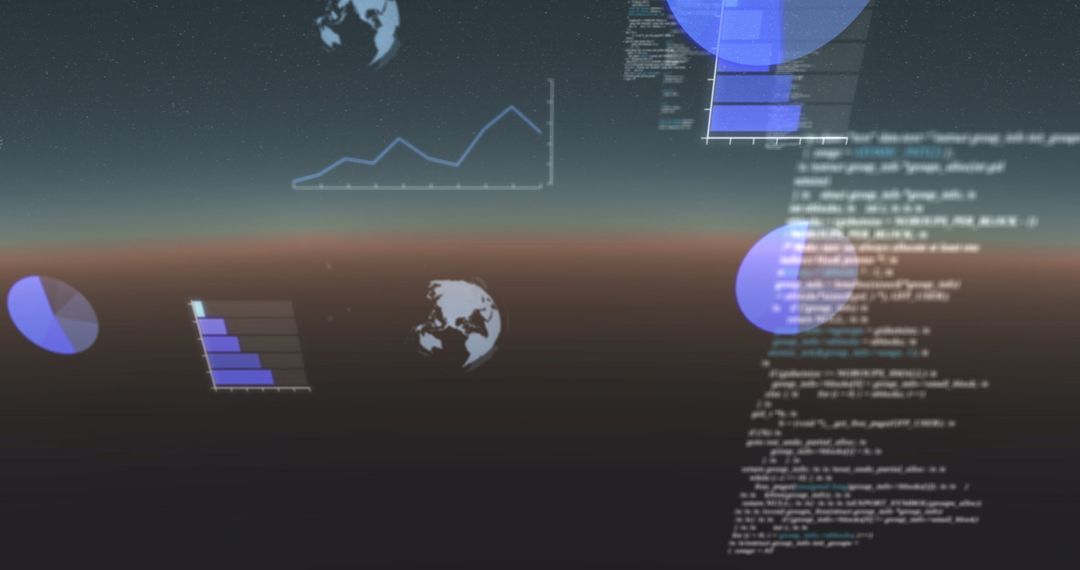
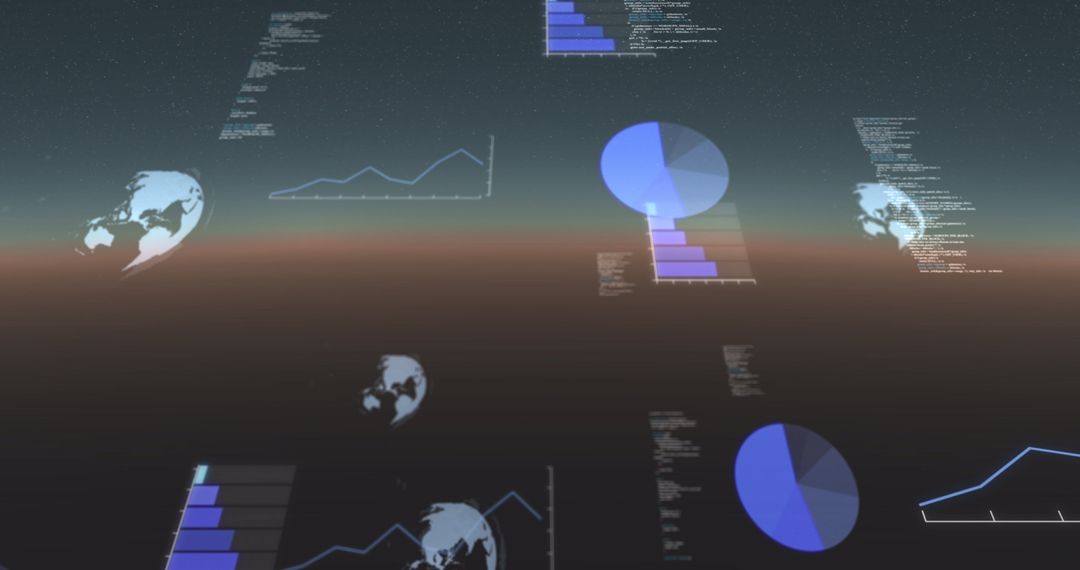
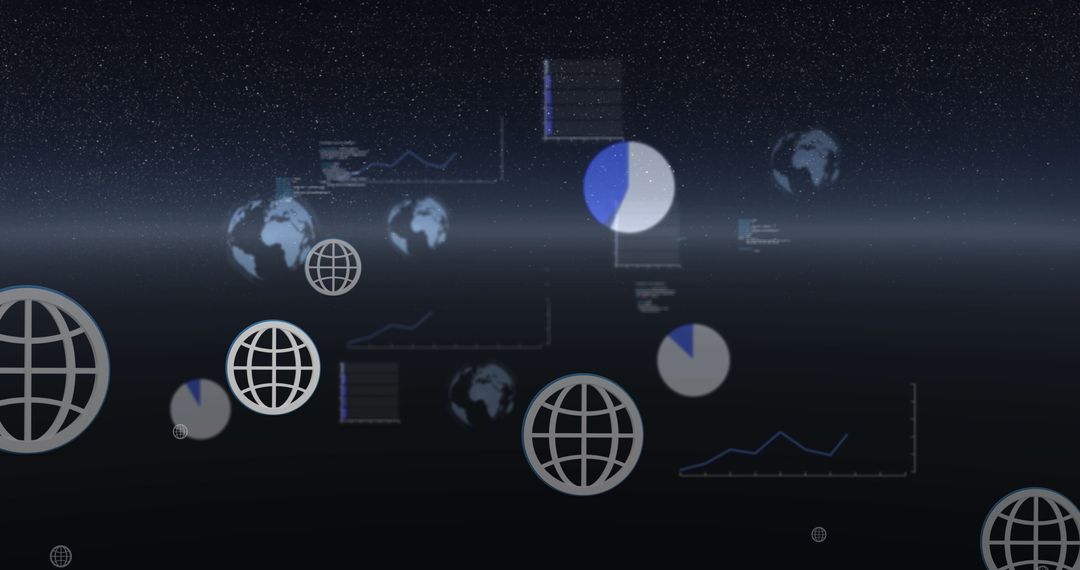
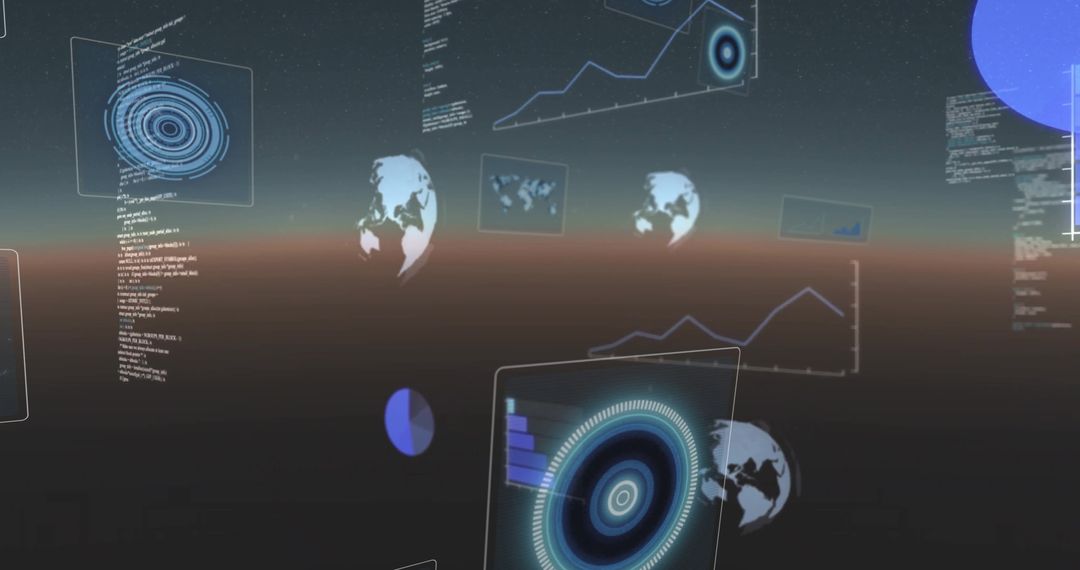
- Holographic 3D Data Visualization with Blue Pie Charts, Line Graphs and Global Network
Holographic 3D Data Visualization with Blue Pie Charts, Line Graphs and Global Network Image
Depicting holographic 3D data visualization with central white line graphs and blue pie charts floating over starfield backdrop. Translucent globes and thin connection lines accentuating global analytics narrative. Overlaying alphanumeric codes and chart elements suggesting real-time telemetry and network monitoring. Employing deep navy and electric blue palette for high-tech, futuristic mood. Serving website hero banners, SaaS product landing pages, corporate presentations, investor decks, technology blogs, cybersecurity and fintech marketing, video intros and broadcast graphics. Cropping to wide banner emphasizing horizontal data flow or to square for social media thumbnails. Pairing with clean sans-serif typography and light overlay for headline legibility. Providing layered elements for motion graphics and AR mockups, or using static still for editorial illustration and background art.
Powered by 


0
downloads
downloads
Tags:
More
Credit Photo
If you would like to credit the Photo, here are some ways you can do so
Text Link
photo Link
<span class="text-link">
<span>
<a target="_blank" href=https://pikwizard.com/photo/holographic-3d-data-visualization-with-blue-pie-charts-line-graphs-and-global-network/b057be8c108ce727884418cd8aed9976/>PikWizard</a>
</span>
</span>
<span class="image-link">
<span
style="margin: 0 0 20px 0; display: inline-block; vertical-align: middle; width: 100%;"
>
<a
target="_blank"
href="https://pikwizard.com/photo/holographic-3d-data-visualization-with-blue-pie-charts-line-graphs-and-global-network/b057be8c108ce727884418cd8aed9976/"
style="text-decoration: none; font-size: 10px; margin: 0;"
>
<img src="https://pikwizard.com/pw/medium/b057be8c108ce727884418cd8aed9976.jpg" style="margin: 0; width: 100%;" alt="" />
<p style="font-size: 12px; margin: 0;">PikWizard</p>
</a>
</span>
</span>
Free (free of charge)
Free for personal and commercial use.
Author: Authentic Images
Similar Free Stock Images
Premium

Premium


Premium


Premium


Premium


Premium


Premium


Premium


Premium


Premium


Premium


Premium


Premium


Premium


Premium


Premium


Premium


Premium


Premium


Premium


Premium


Premium


Premium


Premium