
- Home >
- Stock Photos >
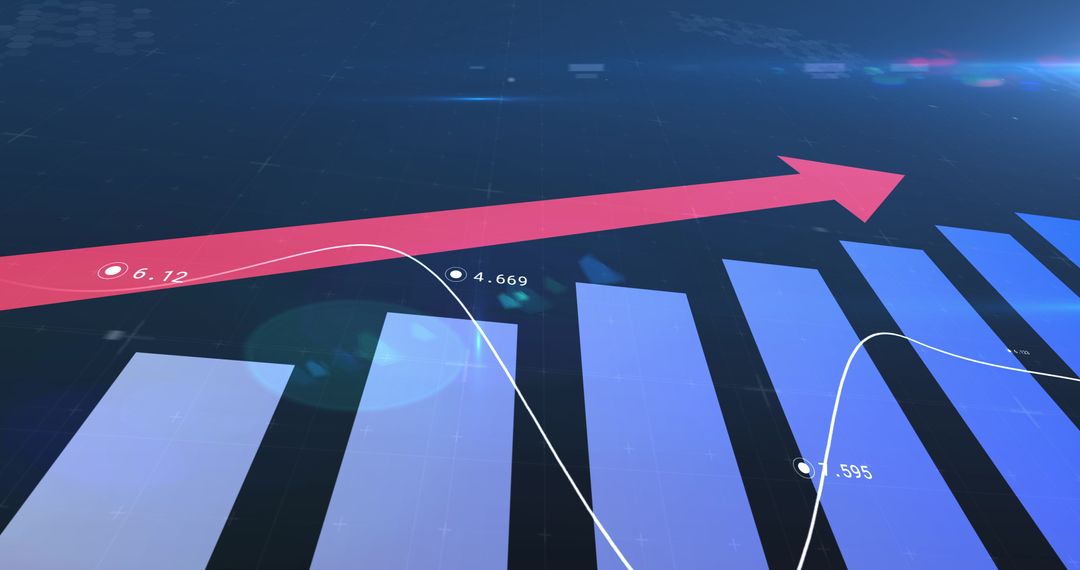
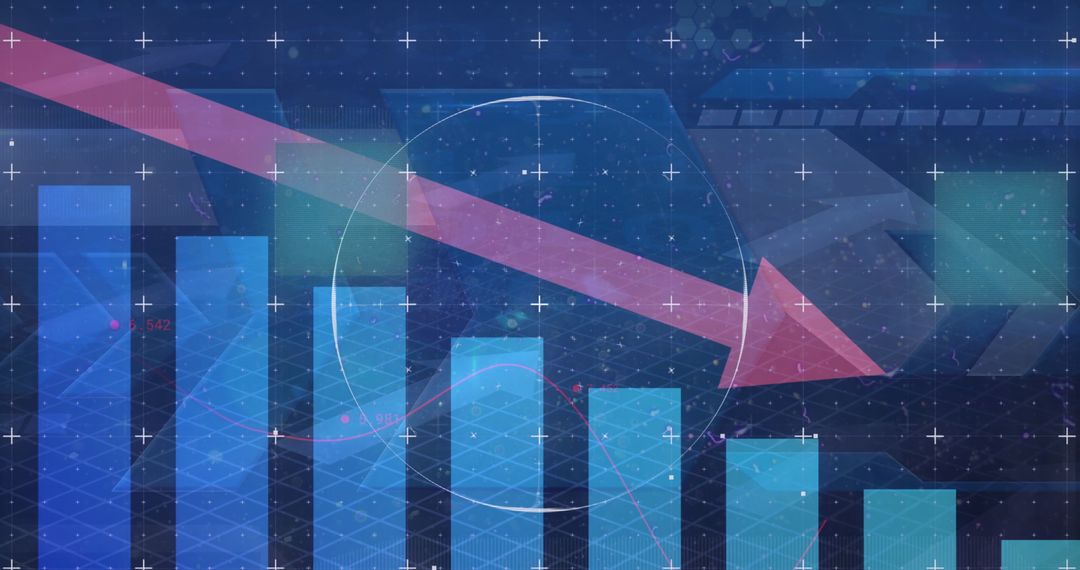
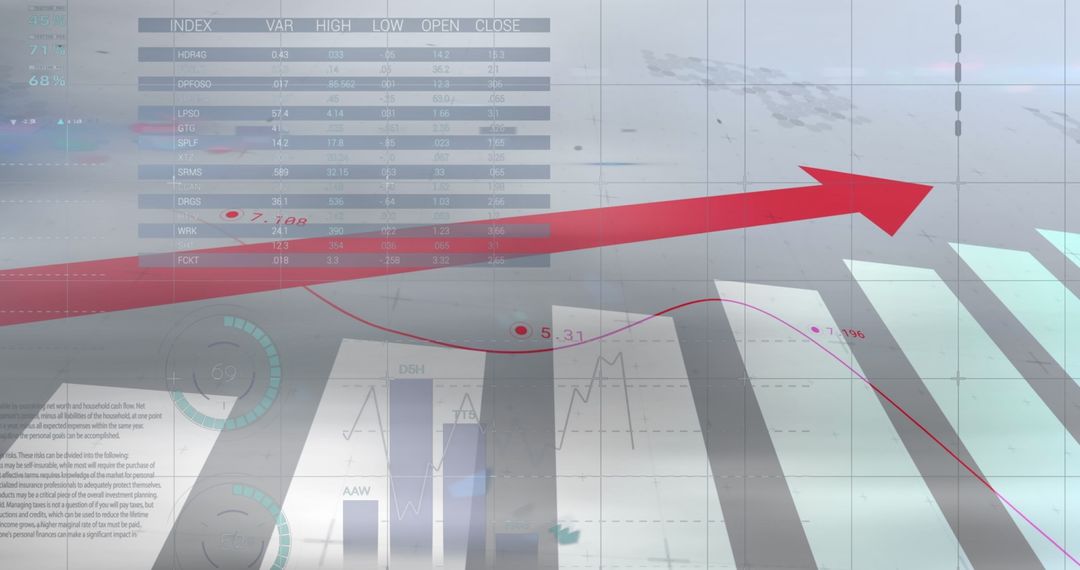
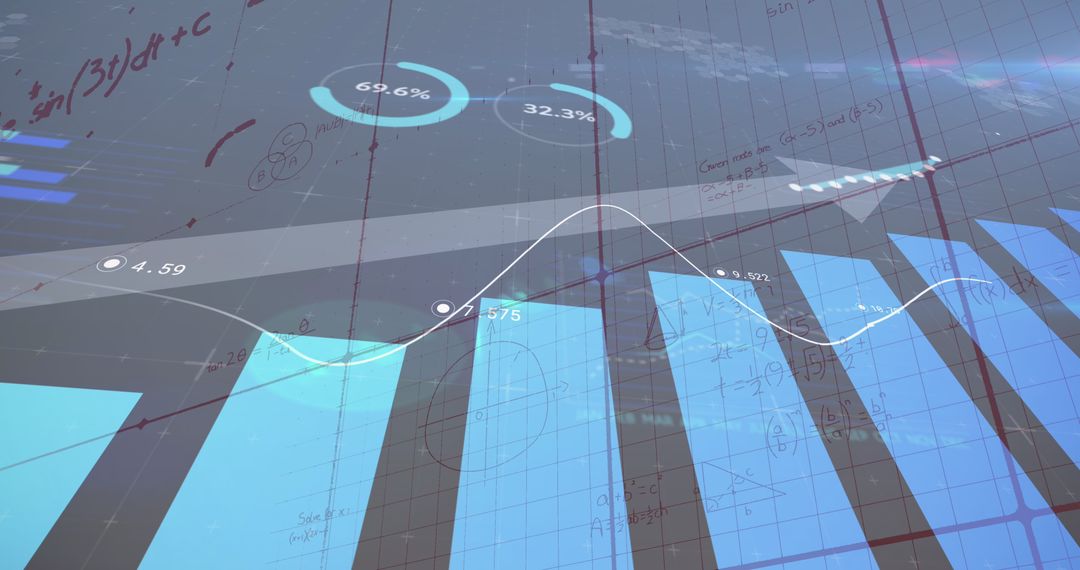
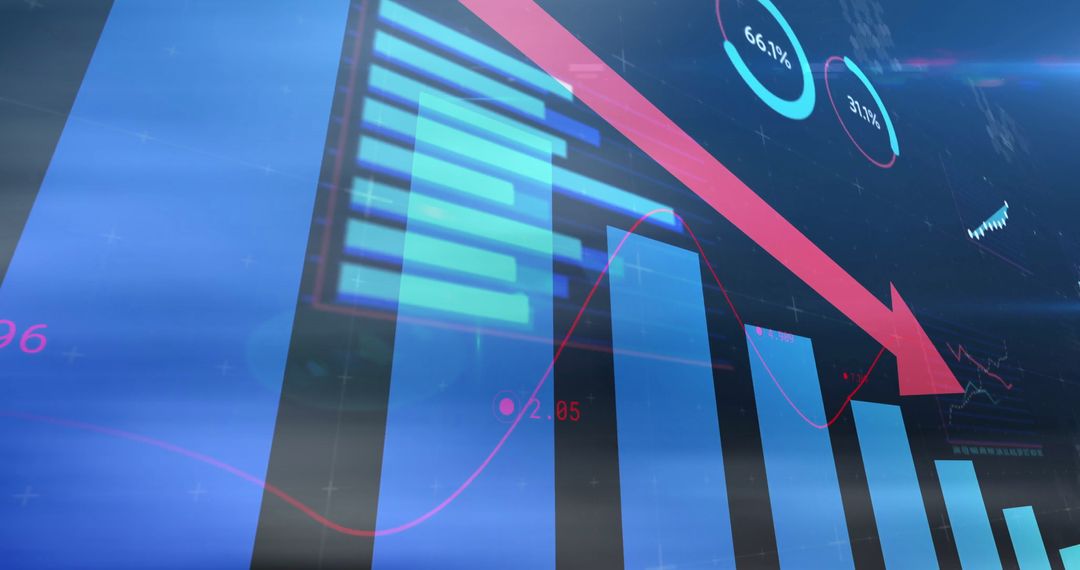
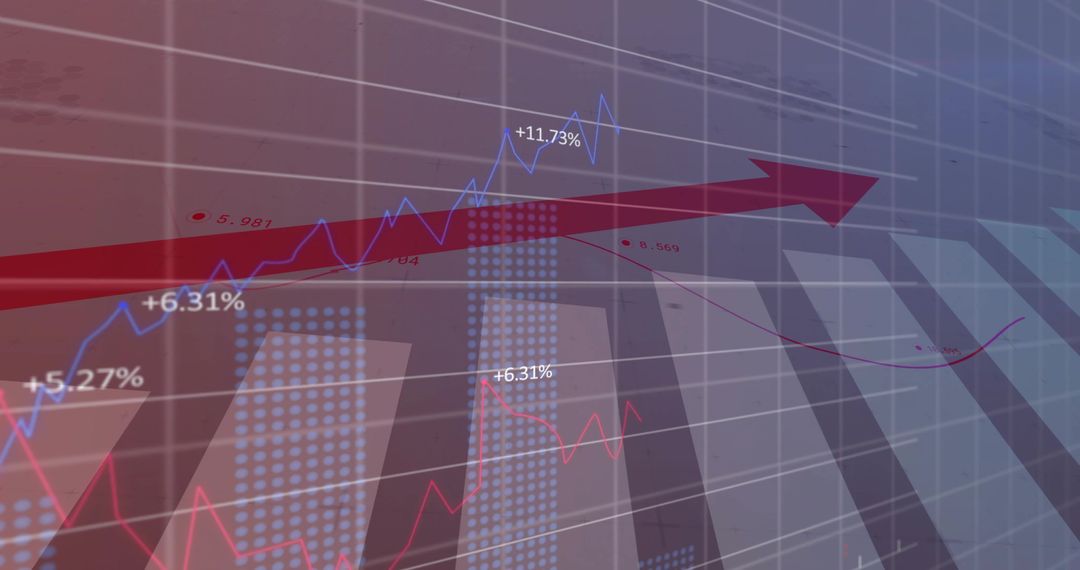
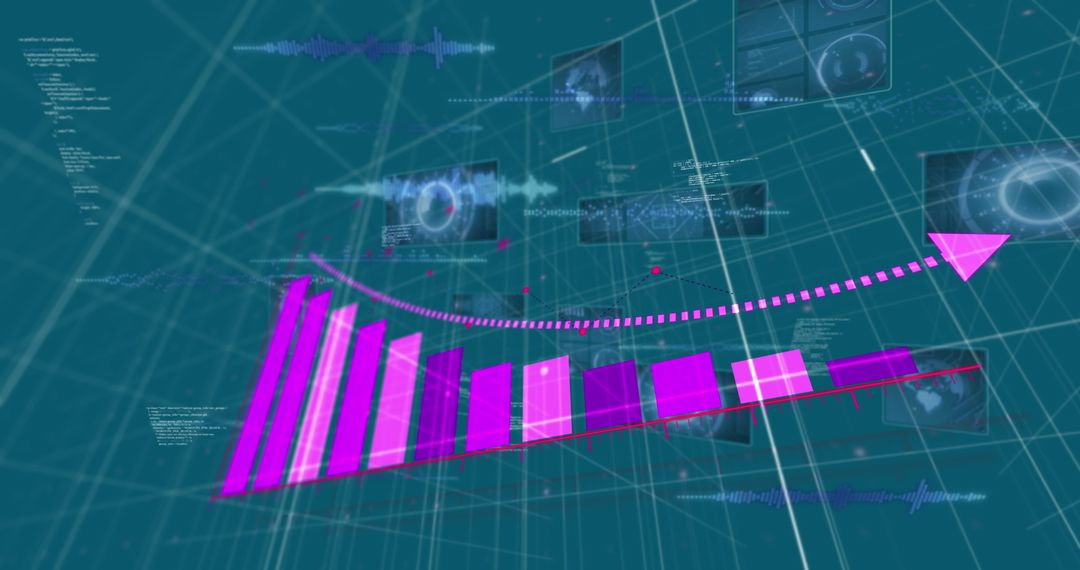
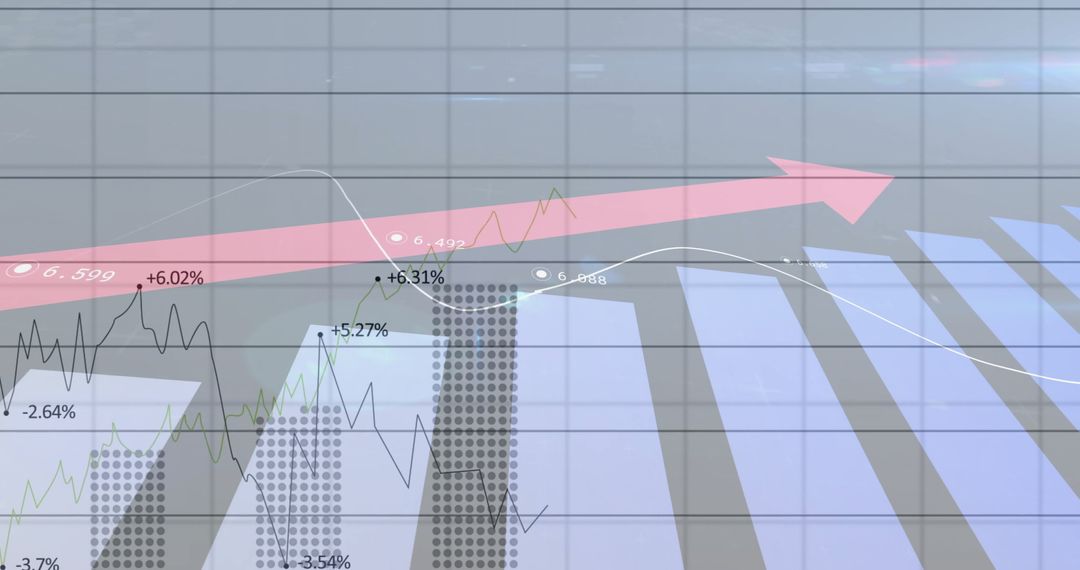
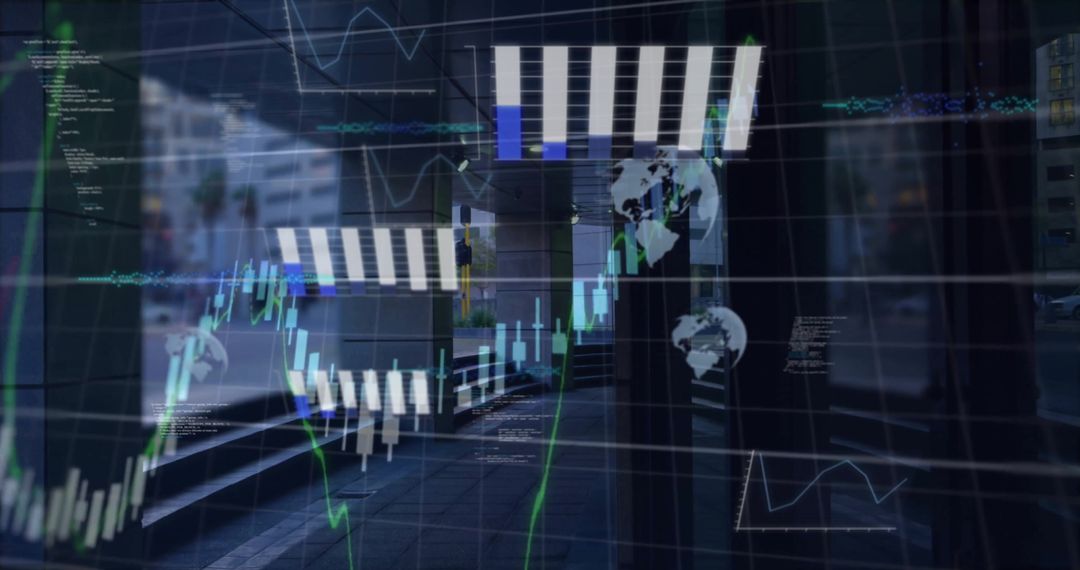
- Holographic 3D Financial Dashboard Displaying Rising Market Trend with Red Arrow and Bar Charts
Holographic 3D Financial Dashboard Displaying Rising Market Trend with Red Arrow and Bar Charts Image

Showing holographic 3D financial dashboard with layered bar charts, candlestick overlays and bold red arrow indicating upward market momentum. Featuring neon color palette, transparent panels and dynamic data overlays for modern fintech and business visuals. Working well for fintech websites, trading platform landing pages, investor presentations, market analysis reports, social media campaigns and annual report covers. Offering flexible cropping for hero banners, slide backgrounds, blog headers and marketing collateral focused on investment, growth, analytics and trading.
Powered by  - Get 15% off with code: PIKWIZARD15


0
downloads
downloads
Tags:
More
Credit Photo
If you would like to credit the Photo, here are some ways you can do so
Text Link
photo Link
<span class="text-link">
<span>
<a target="_blank" href=https://pikwizard.com/photo/holographic-3d-financial-dashboard-displaying-rising-market-trend-with-red-arrow-and-bar-charts/e28f1d12ca98b96f9d8e3973e3fb6d72/>PikWizard</a>
</span>
</span>
<span class="image-link">
<span
style="margin: 0 0 20px 0; display: inline-block; vertical-align: middle; width: 100%;"
>
<a
target="_blank"
href="https://pikwizard.com/photo/holographic-3d-financial-dashboard-displaying-rising-market-trend-with-red-arrow-and-bar-charts/e28f1d12ca98b96f9d8e3973e3fb6d72/"
style="text-decoration: none; font-size: 10px; margin: 0;"
>
<img src="https://pikwizard.com/pw/medium/e28f1d12ca98b96f9d8e3973e3fb6d72.jpg" style="margin: 0; width: 100%;" alt="" />
<p style="font-size: 12px; margin: 0;">PikWizard</p>
</a>
</span>
</span>
Free (free of charge)
Free for personal and commercial use.
Author: Creative Art
Similar Free Stock Images
Premium


Premium


Premium


Premium


Premium


Premium


Premium


Premium


Premium


Premium


Premium


Premium


Premium


Premium


Premium


Premium


Premium


Premium


Premium


Premium


Premium


Premium


Premium


Premium

