- Home >
- Stock Photos >
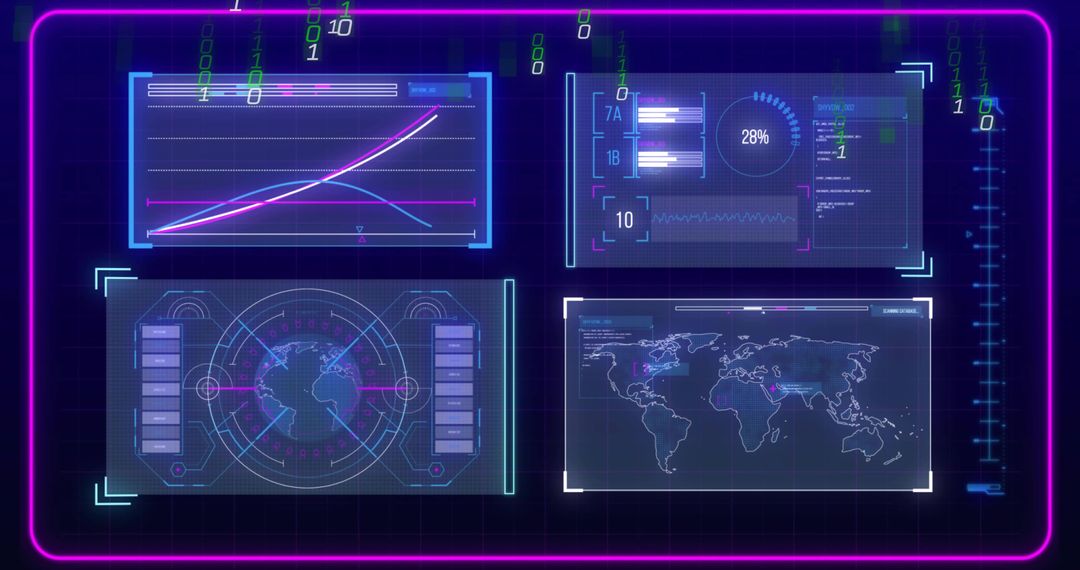
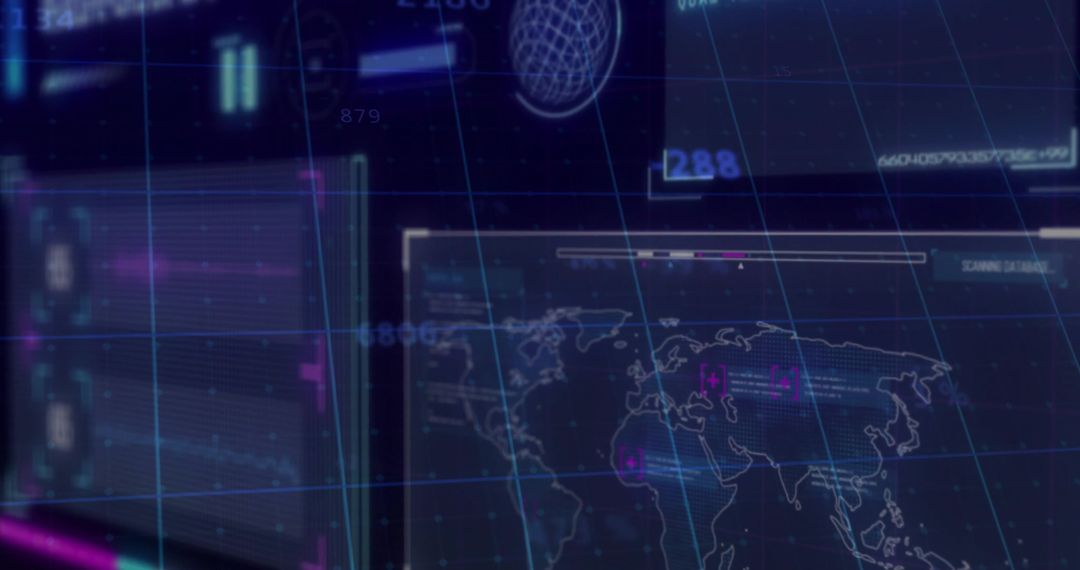
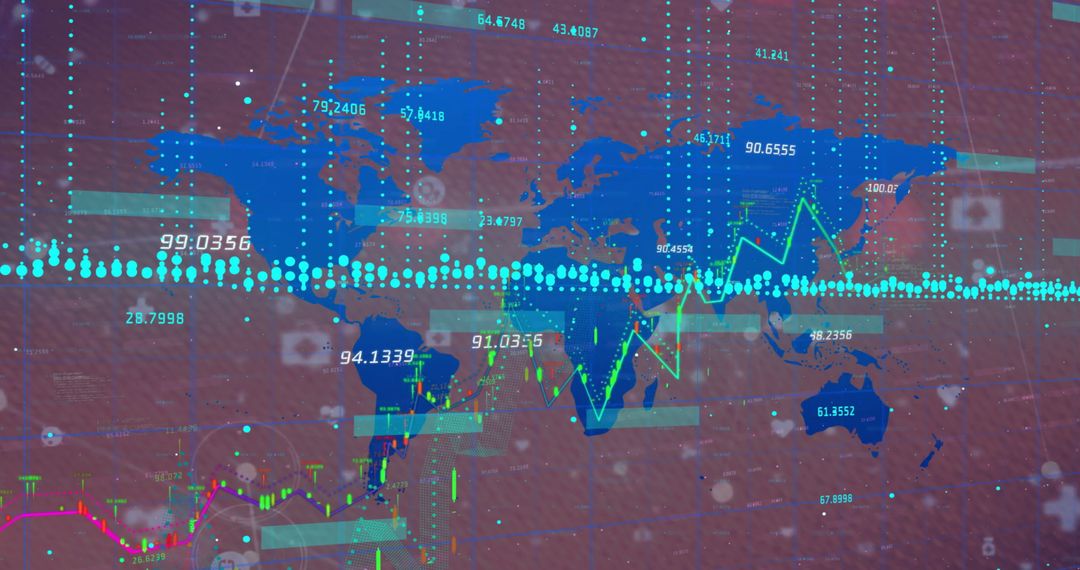
- Holographic Analytics Dashboard Showing Neon Multiscreen UI with Line Charts, Radar, World Map
Holographic Analytics Dashboard Showing Neon Multiscreen UI with Line Charts, Radar, World Map Image

Providing high-tech holographic dashboard with glowing neon panels showing line charts, radar visualization, and world map for global data tracking. Suitting tech brands, BI vendors, cybersecurity teams, and data science blogs for use as hero banner, website header, presentation slide, or marketing background. Supporting layout customization by leaving top-left panel clear for logo or text overlay and using dark translucent bars for caption readability. Working well for illustrating real-time monitoring, network operations, IoT dashboards, predictive analytics, or futuristic UI concepts. Recommending color palette of cyan, magenta, and deep indigo to maintain contrast and legibility. Including suggestions for cropping to focus on single panel or using full-frame for immersive effect. Delivering high-impact visual for social media ads, product demos, investor decks, and editorial about data strategy.
Powered by 


0
downloads
downloads
Tags:
More
Credit Photo
If you would like to credit the Photo, here are some ways you can do so
Text Link
photo Link
<span class="text-link">
<span>
<a target="_blank" href=https://pikwizard.com/photo/holographic-analytics-dashboard-showing-neon-multiscreen-ui-with-line-charts-radar-world-map/738040d6babe3add0b3b0604c9f58795/>PikWizard</a>
</span>
</span>
<span class="image-link">
<span
style="margin: 0 0 20px 0; display: inline-block; vertical-align: middle; width: 100%;"
>
<a
target="_blank"
href="https://pikwizard.com/photo/holographic-analytics-dashboard-showing-neon-multiscreen-ui-with-line-charts-radar-world-map/738040d6babe3add0b3b0604c9f58795/"
style="text-decoration: none; font-size: 10px; margin: 0;"
>
<img src="https://pikwizard.com/pw/medium/738040d6babe3add0b3b0604c9f58795.jpg" style="margin: 0; width: 100%;" alt="" />
<p style="font-size: 12px; margin: 0;">PikWizard</p>
</a>
</span>
</span>
Free (free of charge)
Free for personal and commercial use.
Author: Creative Art
Similar Free Stock Images

Premium


Premium


Premium


Premium


Premium


Premium


Premium


Premium


Premium


Premium


Premium


Premium


Premium


Premium


Premium


Premium


Premium


Premium


Premium


Premium


Premium


Premium


Premium


Premium