1. Home > 
  2. Stock Photos > 
  3. Holographic Charts with Social Media Notifications

Holographic Charts with Social Media Notifications Image

Holographic Charts with Social Media Notifications

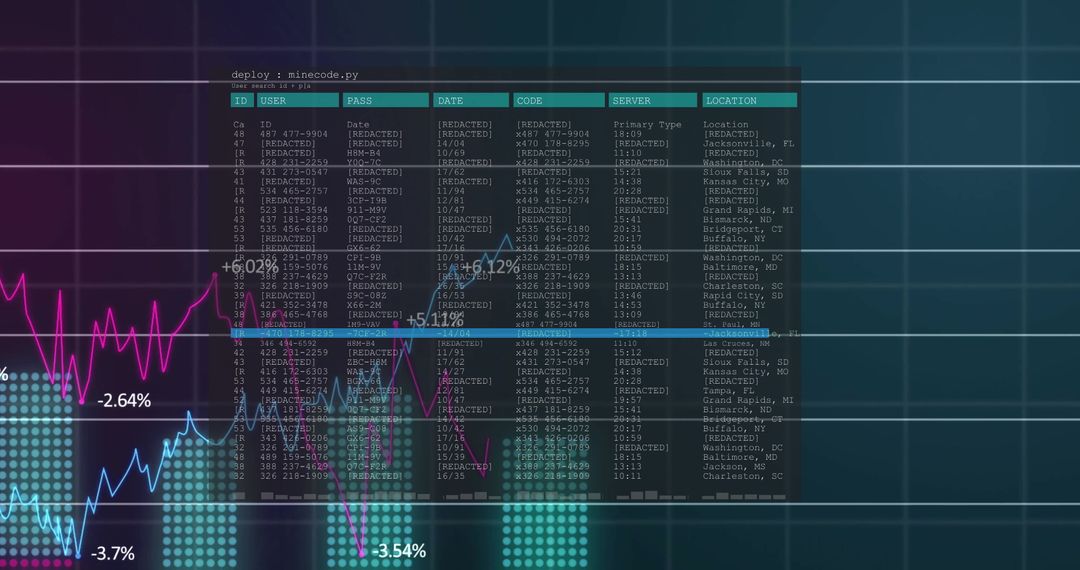
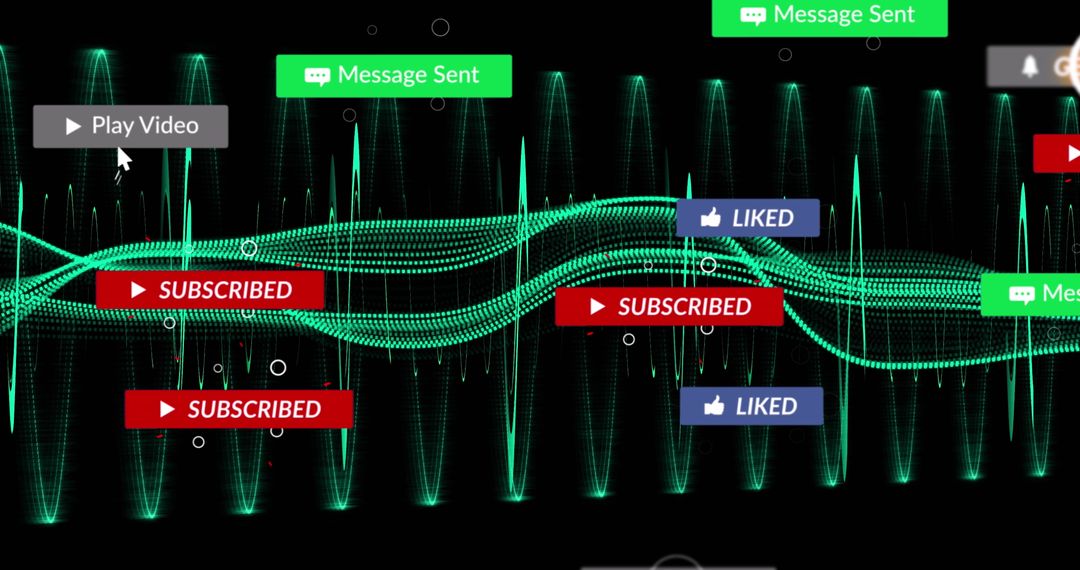
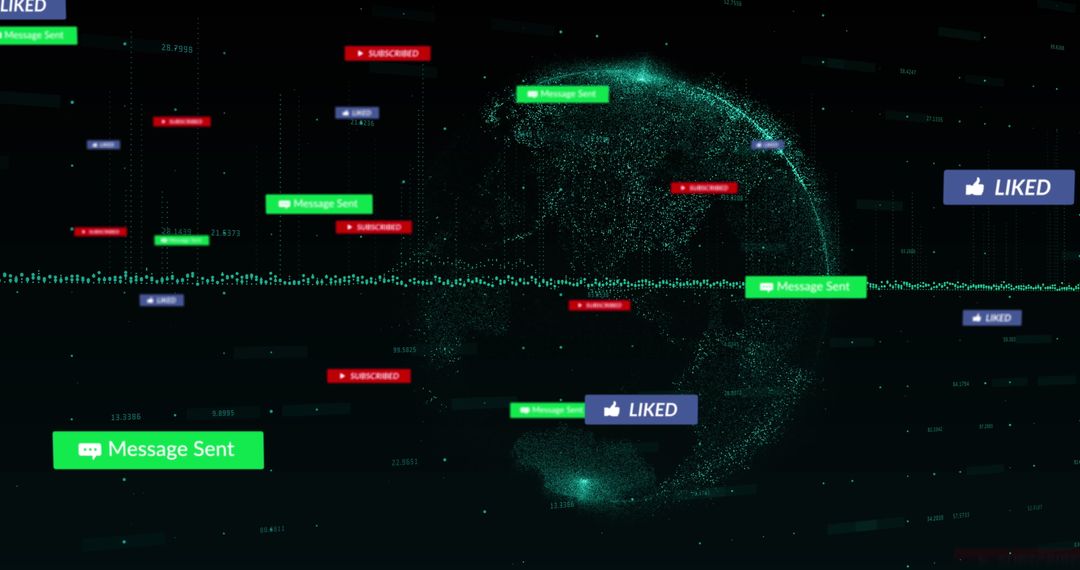
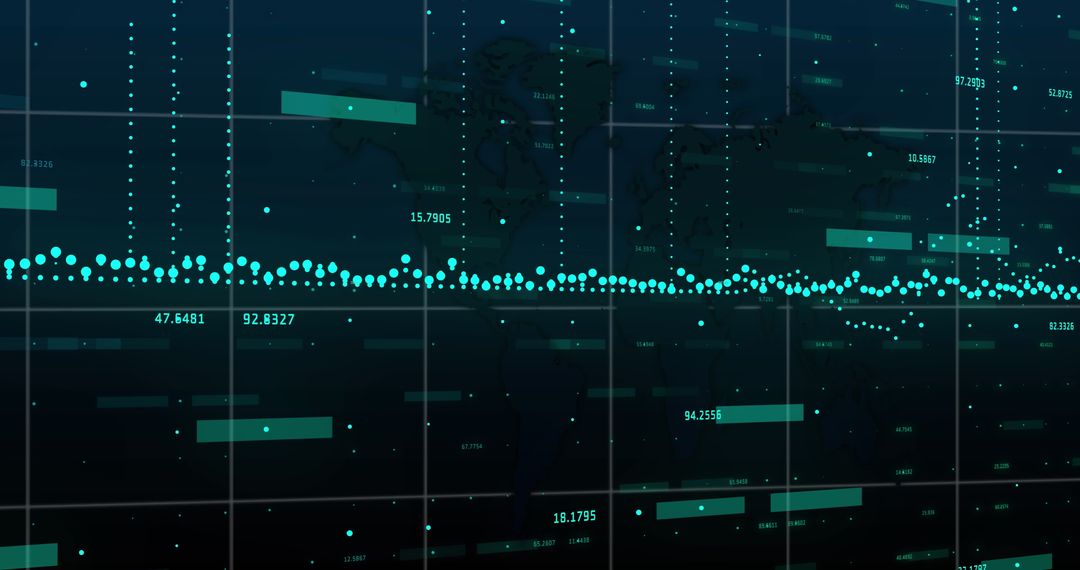
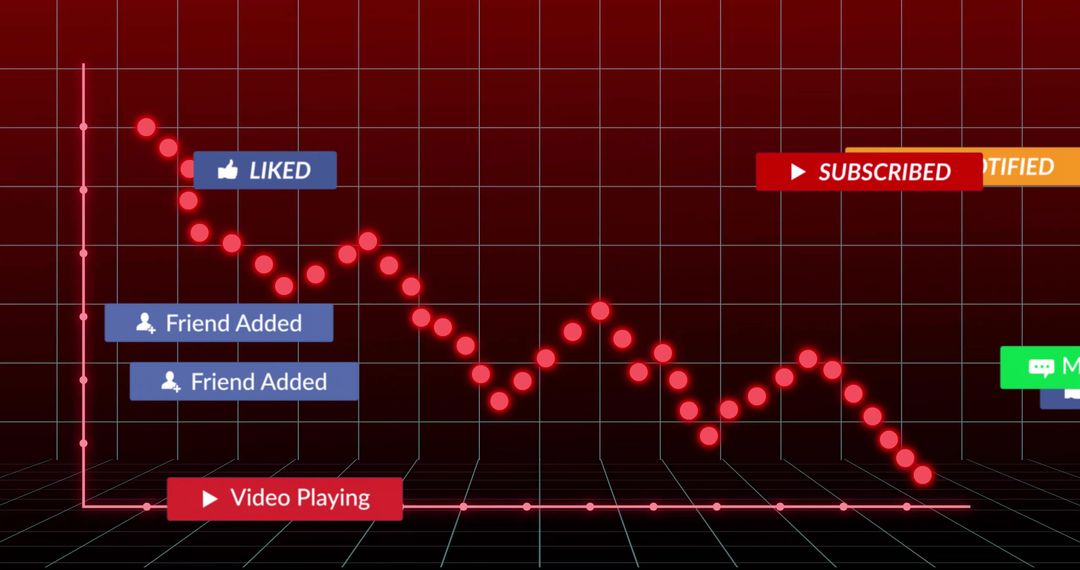
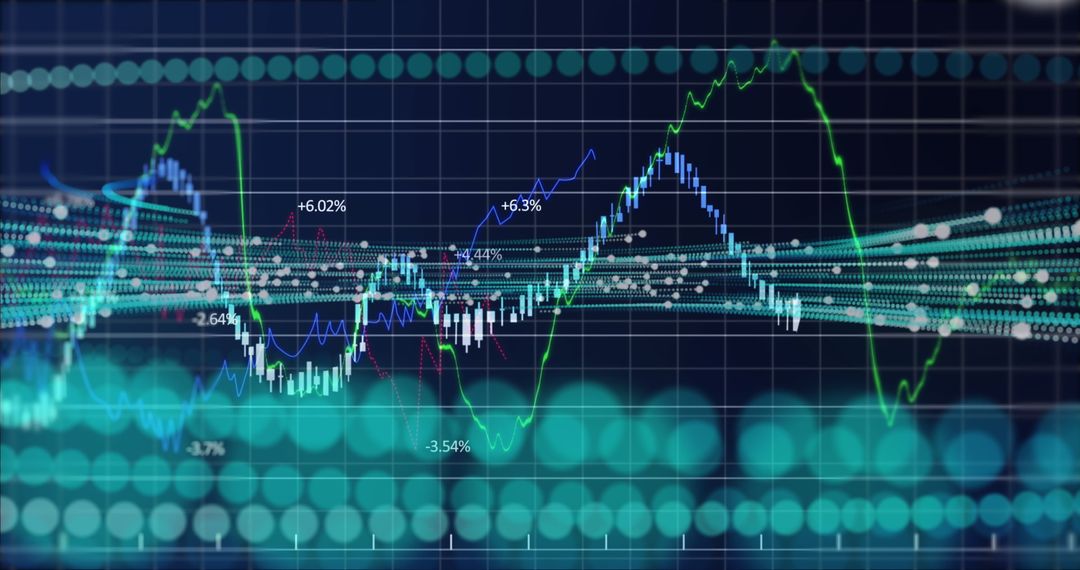
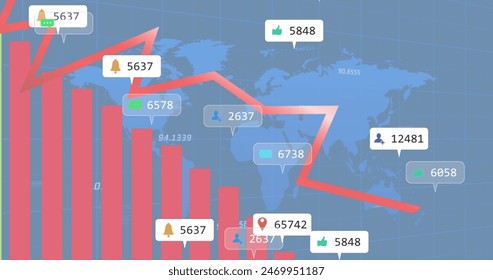
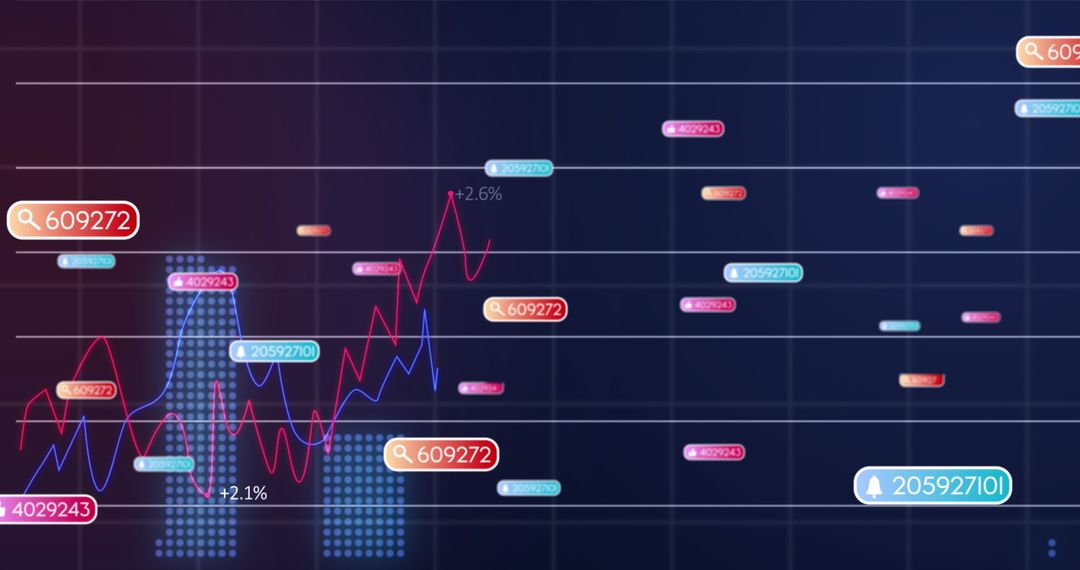
Visual showcasing holographic charts with social media notifications symbolizes fast-paced business analytics and technological growth. Excellent for content about digital marketing strategies, technological advancement discussions, data visualization projects, and social media engagement analysis.

Powered by Shutterstock logo - Get 15% off with code: PIKWIZARD15
Image of notification bars, graphs with changing numbers, trading board over black background. Digitally generated, hologram, report, business, stock market, coding, social media concept. - Powered by Shutterstock - Get 15% off with code: PIKWIZARD15Creative abstract postal envelopes hologram and modern desktop with pc on background, email and notification concept. Multiexposure - Powered by Shutterstock - Get 15% off with code: PIKWIZARD15Displaying notification bubble showing thirteen likes floating over map screen, with brain hologram. Technology, data, analytics, digital, visualization, innovation, network - Powered by Shutterstock - Get 15% off with code: PIKWIZARD15Business Men And Women Using Digital Technology - Powered by Shutterstock - Get 15% off with code: PIKWIZARD15Hand interacting with digital cybersecurity alert interface, futuristic graphic style, dark tech background, concept of data breach or cyber threat - Powered by Shutterstock - Get 15% off with code: PIKWIZARD15

Credit Photo

If you would like to credit the Photo, here are some ways you can do so

Free (free of charge)

Free for personal and commercial use.

Author: People Creations

Similar Free Stock Images

Dynamic Financial Data Display in Digital Space
Premium
Abstract virtual postal envelopes hologram on coins background, email and notification concept. Multiexposure
Digital Stock Market Trends and Financial Growth Analysis
Financial Data Visualization with Cityscape Overlay
Financial Data Graph Rendering Global Market Trends
Dynamic Green Stock Chart on Digital Grid Background
Premium
Digital calendar on computer screen, graphic style, on keyboard background, concept of time management
Financial Data Statistics Visualized in Urban Setting
Dynamic Stock Market Graph Displaying Surging Growth
Digital Financial Data Analysis with Graphs and Stock Market Trends
Social Media Activity Icons on Digital Graph
Premium
Digital calendar on laptop screen, graphic style, blue background, concept of time management and business planning
Data Analytics Graphs on Digital Interface Background
Dynamic Business Data and Cityscape Visualization
Dynamic Forex Trading Graphs with Increasing Numbers
Digital Finance Network with User Profiles and Graphs
Premium
Double exposure of abstract creative statistics data hologram with finger clicks on a digital tablet on background, analytics and forecasting concept
Rising Financial Data Graph on Digital Grid Background
Dynamic Lines Show Rising Financial Statistics Over Time
Digital Financial Data and AI Illustration Networking Globally
Digital Data and Financial Charts on White Background
Premium
Multi exposure of abstract statistics data hologram interface and modern digital tablet on background, computing and analytics concept
Digital Financial Data Analysis on Grid Framework
Abstract Financial Data Processing and Analysis Interface
Dynamic Stock Market Chart with Fluctuating Trends and Data Points
Digital Visualization of Global Networking with Statistical Graphs
Premium
Creative abstract economic crisis chart with world map hologram and with finger presses on a digital tablet on background, bankruptcy and recession concept. Multiexposure
Data Visualization with Line Charts and Cyberspace Interface
Futuristic Data Analytics Dashboard with Graphs and Code Interface
Fluctuating Line Chart on Analytics Dashboard Interface
Futuristic Financial Data Chart with Teal Grid Elements and Code Snippets
Digital Finance Data Overlaying Futuristic Cityscape
Digital Financial Data and Global Business Analytics
Premium
Double exposure of abstract creative statistics data hologram with finger clicks on a digital tablet on background, analytics and forecasting concept
Dynamic Digital Data Analysis on Elevated Grid
Financial Data Flow against Urban Skyline Backdrop
Rising Digital Graph and Data Visualizations on Black Background
Digital Finance: Modern Stock Market Analysis Display
Premium
Creative abstract economic crisis chart with world map hologram and with finger presses on a digital tablet on background, bankruptcy and recession concept. Multiexposure
Dynamic Stock Market Graphs and Financial Data
Data Trends and Analysis on 3D Digital Grid
Digital Threads of Social Media Interaction and Connectivity
Digital Financial Data Graph Showcasing Market Trends
Premium
Calendar on laptop screen, digital style, blue background, concept of time management
Abstract Financial Market Data with CGI and Code Overlay
Digital Global Communication and Social Interactions Concepts
Financial Graphs Overlaying Industrial Junkyard
Dynamic Statistical Data Analysis on Digital Grid Network
Premium
Creative abstract economic crisis chart with world map hologram and modern digital tablet on desktop on background, top view, bankruptcy and recession concept. Multiexposure
Global Digital Interface with Data Points and Connectivity
Abstract Digital Stock Market Analysis with Graphs
Analyzing Financial Data on Digital World Map Background
Interactive Social Media Metrics Overlaid on Business Data Graph
Premium
Double exposure of creative USD symbols hologram and hands typing on laptop on background. Banking and investing concept
Financial Data with Molecular Background Concept
Financial Growth Statistic Data Processing Over Urban Cityscape
Abstract Data Visualization with Technological Grid Background
Global Financial Data Trends on Digital World Map Display
Premium
Creative abstract economic crisis chart with world map hologram and with hands typing on computer keyboard on background, bankruptcy and recession concept. Multiexposure
Digital Finance Dashboard Showing Candlestick and Line Charts
Descending Data Trend Line on Futuristic Digital Dashboard
Displaying pixelated user profile overlaying blue and red trend lines on analytics panel
Digital Financial Data Interface with Analytics
Financial Data Visualization Over Futuristic Cityscape
Financial Data Overlay on Cityscape Visualizing Market Trends
Premium
Abstract virtual postal envelopes hologram on a modern coworking room background, email and notification concept. Multiexposure
Data Recovery Progress Display on Digital Interface
Data Analytics and Financial Growth Indicators
Financial Data Charts in Shimmering Blue Digital Space
Digital Financial Data with Graph and Grid Patterns
Premium
Abstract virtual postal envelopes hologram on blurry skyscrapers background, email and notification concept. Multiexposure
Dynamic Financial Charts and Graphs Indicating Market Trends
Dynamic Financial Growth Digital Chart Display
Digital Financial Data Overlay on Urban Street Scene
Rising Graphs and Interactive Financial Data Analytics Background
Premium
Double exposure of creative abstract global crisis chart with world map hologram and finger clicks on a digital tablet on background. Financial crisis and recession concept
Digital Data Visualization with Trend Lines and Percentage Changes
Financial Growth Graph and Data Analytics Representation
Financial Graphs with Social Media Analytics on Digital Chart
Dynamic Financial Data Visualization on Digital Grid Background
Premium
Businessman hand is using tablet to view stock market data chart and turn on notification application. Stock market and investor concept
Digital Cityscape with Financial Data Overlay
Dynamic Financial Graphs Overlaying Modern Cityscape
Dynamic Financial Graphs Overlaying Urban Skyline
Abstract Financial Chart Showing Upward Trend in Global Market
Premium
Multi exposure of creative statistics data hologram with hands typing on computer keyboard on background, stats and analytics concept
Dynamic Graphic of Financial Data Displayed on Graph
Dynamic Financial Data and Stock Market Charts
Abstract Visualization of Data Analytics Dashboard with Speech Bubbles
Candlestick Chart Visualization with Indicators and Growth Highlight
Premium
Double exposure of postal envelopes hologram with hands typing on laptop on background. Electronic mail and spam concept
Financial Dashboard with Line and Bar Graphs for Market Analysis
Tracking neon-cyan analytics dashboard showing social engagement peaks with 5760 likes tooltip
Financial Data Displayed Over City Skyline with Rising Graphs
Financial Data Analysis with Global Digital Interface
Digital Financial Data Overlaying City Skyline at Dusk
Digital Interface with Virtual Data Surging Across Connection Globes
Premium
Image of graphs, notification bars and numbers with map over blue background. Digitally generated, hologram, illustration, report, business, social media, global and technology concept.
Digital Data Analytics Overlay on Cityscape
Financial Graph and Waves Representing Market Trends and Data
Optimized Statistical Data Overlain on Corporate Architecture
Dynamic Data Graphs on Digital Interface Background
Premium
Double exposure of creative abstract global crisis chart with world map hologram and finger clicks on a digital tablet on background. Financial crisis and recession concept
European Market Data Overlay with EU Flag and Financial Graphs
Financial Data Analysis with Declining Trends
Holographic Financial Graph with Dynamic Line Chart
Digital Finance Data Overload with Code and Graphs
Premium
Double exposure of abstract creative statistics data hologram and modern digital tablet on background, analytics and forecasting concept
Abstract Data Visualization with Dynamic Charts and Graphs
Dynamic Data Visualization with Financial Charts and 3D Elements
Abstract Digital Charts with Social Media Metrics Rising
Futuristic Keyboard Analytics Display with Digital Graphs and Numbers
Premium
Double exposure of creative EURO USD forex chart hologram and digital tablet on background, top view. Banking and investing concept
Social Media Integration with Statistical Data Analysis
Dynamic Financial Data Overlaid on Grid Background
Financial Data Analysis with Growing Stock Trends
Dynamic Financial Data Displays Stock Market Trends
Premium
Creative abstract economic crisis chart with world map hologram and with hands typing on computer keyboard on background, bankruptcy and recession concept. Multiexposure
Futuristic Data Dashboard with Abstract Waveforms and Light Effects
Glowing Data Network in Futuristic 3D Grid with Notifications
Financial Growth Chart with Data Visualization Elements
Neon Candlestick Chart on Grid with Data Analytics Theme
Premium
Creative abstract postal envelopes hologram with finger presses on a digital tablet on background, email and notification concept. Multiexposure
Neon Red Market Trend Line with Social Media Engagement Callouts on Green Data Grid