- Home >
- Stock Photos >
- Holographic Data Analysis Interface with Charts Over Blue Background
Holographic Data Analysis Interface with Charts Over Blue Background Image
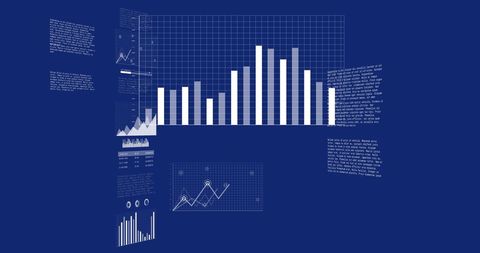
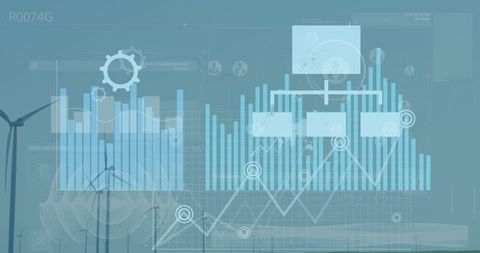
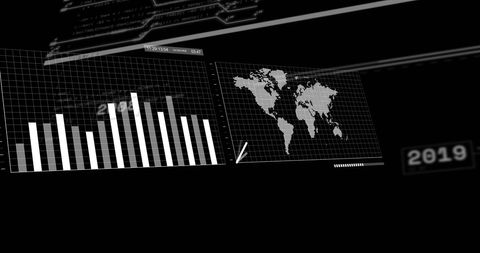
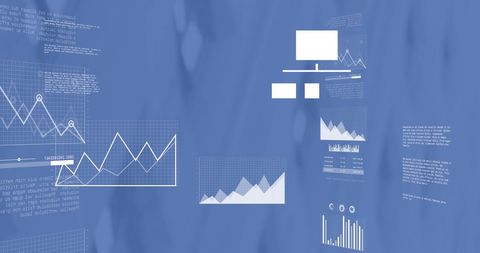
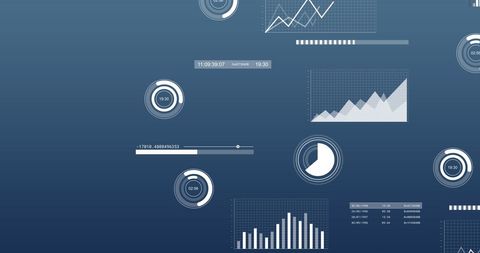
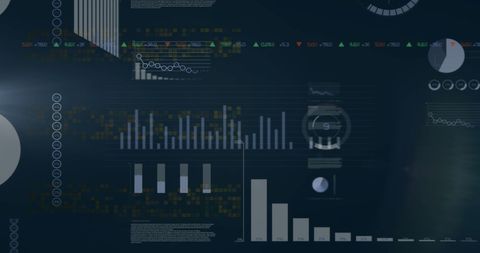
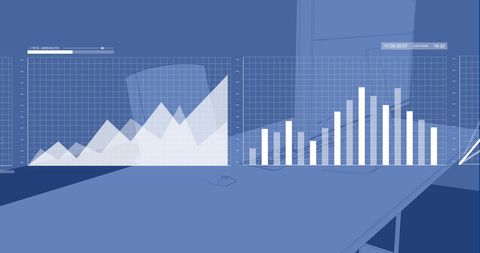
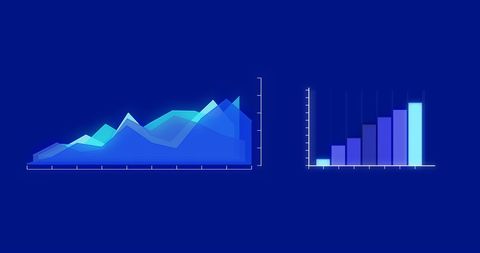
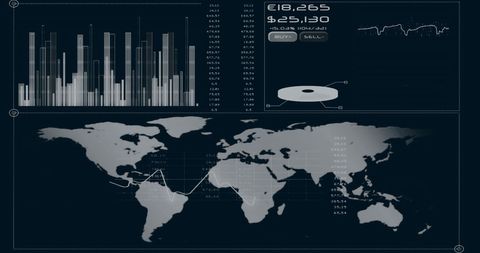
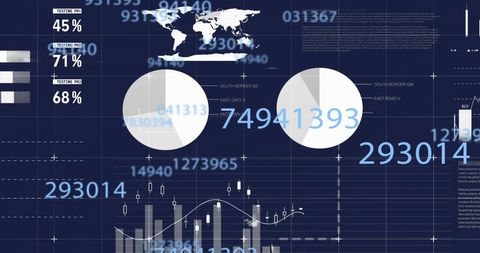
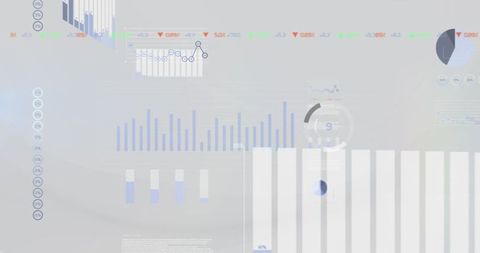
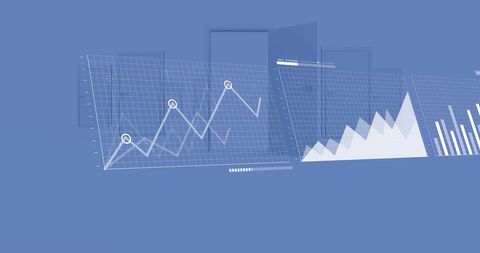
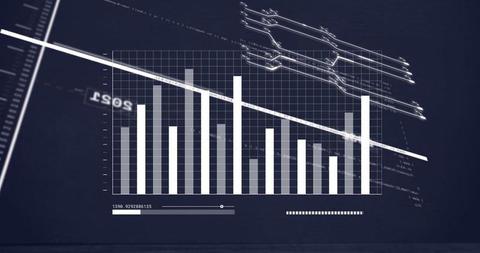
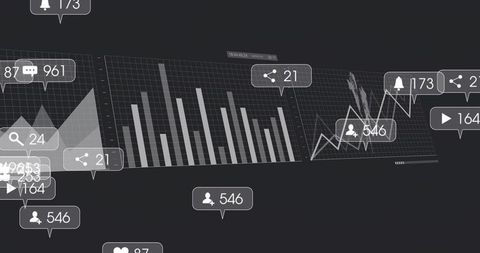
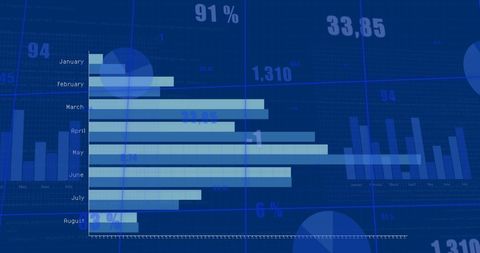
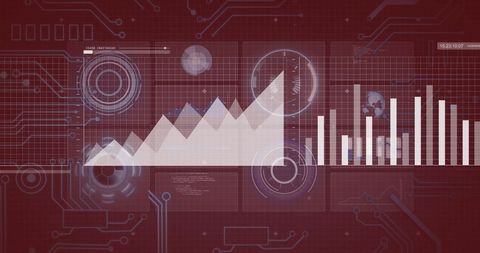
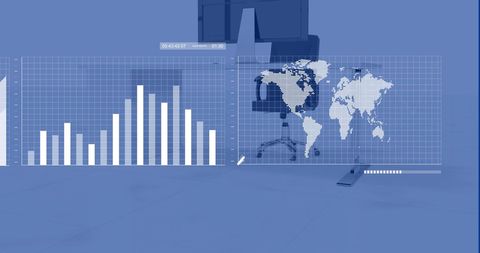
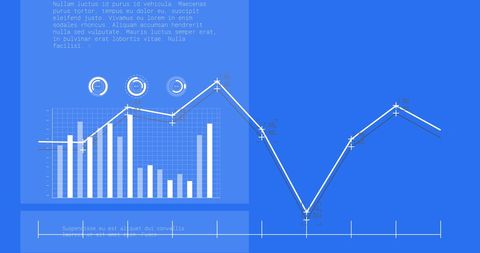
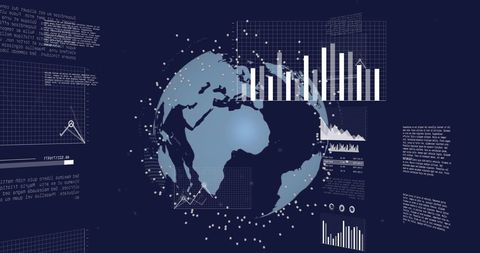
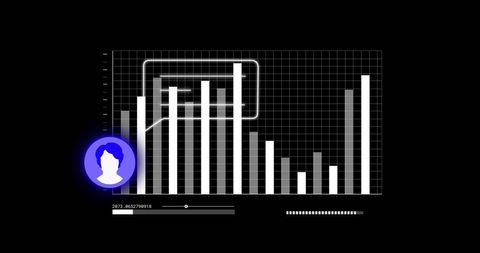
A digital interface displaying various graphs and data visuals against a blue background, representing data analysis and reporting. This versatile illustration is ideal for use in technology articles, business analytics materials, digital transformation presentations, programming tutorials, and reports on data science and technological advancements.

downloads
Tags:
More
Credit Photo
If you would like to credit the Photo, here are some ways you can do so
Text Link
photo Link
<span class="text-link">
<span>
<a target="_blank" href=https://pikwizard.com/photo/holographic-data-analysis-interface-with-charts-over-blue-background/c845de00776fc8aed7baa17da611273d/>PikWizard</a>
</span>
</span>
<span class="image-link">
<span
style="margin: 0 0 20px 0; display: inline-block; vertical-align: middle; width: 100%;"
>
<a
target="_blank"
href="https://pikwizard.com/photo/holographic-data-analysis-interface-with-charts-over-blue-background/c845de00776fc8aed7baa17da611273d/"
style="text-decoration: none; font-size: 10px; margin: 0;"
>
<img src="https://pikwizard.com/pw/medium/c845de00776fc8aed7baa17da611273d.jpg" style="margin: 0; width: 100%;" alt="" />
<p style="font-size: 12px; margin: 0;">PikWizard</p>
</a>
</span>
</span>
Free (free of charge)
Free for personal and commercial use.
Author: Creative Art