
- Home >
- Stock Photos >
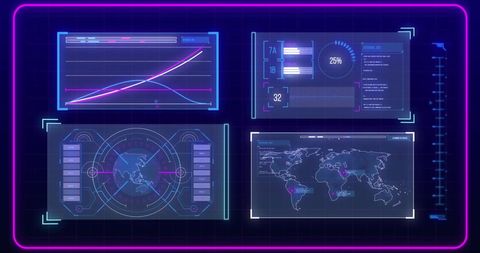
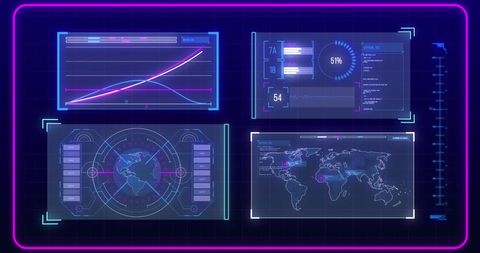
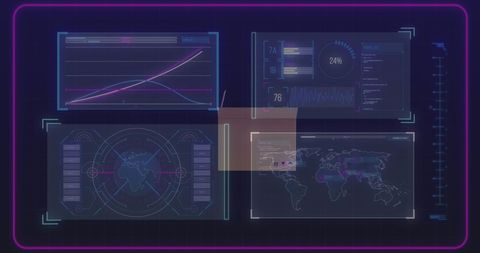
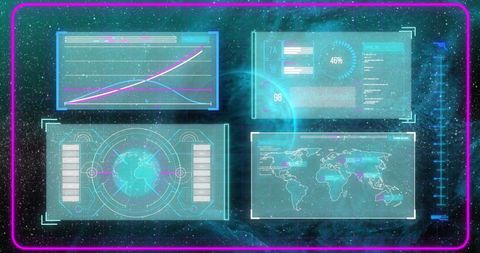
- Holographic Data Interface with Graphs and Maps
Holographic Data Interface with Graphs and Maps Image
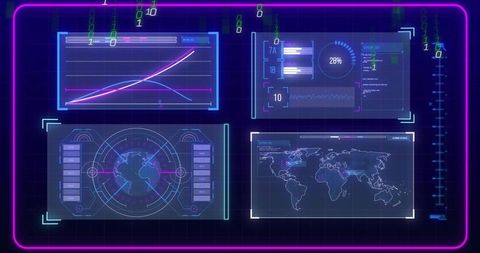
Futuristic holographic display features a series of interactive graphs and world maps, highlighting data trends and analytics in vibrant neon colors. Binary digits and circular graphs dominate vibrant digital interface, catering to technology demonstrations or sci-fi media. Suitable for illustrating concepts of innovation, data science, or advanced analytics in presentations and visual storytelling.
Powered by  - Get 15% off with code: PIKWIZARD15


downloads
Tags:
More
Credit Photo
If you would like to credit the Photo, here are some ways you can do so
Text Link
photo Link
<span class="text-link">
<span>
<a target="_blank" href=https://pikwizard.com/photo/holographic-data-interface-with-graphs-and-maps/9964cb37c5ad577c67d35d7ed7f12d97/>PikWizard</a>
</span>
</span>
<span class="image-link">
<span
style="margin: 0 0 20px 0; display: inline-block; vertical-align: middle; width: 100%;"
>
<a
target="_blank"
href="https://pikwizard.com/photo/holographic-data-interface-with-graphs-and-maps/9964cb37c5ad577c67d35d7ed7f12d97/"
style="text-decoration: none; font-size: 10px; margin: 0;"
>
<img src="https://pikwizard.com/pw/medium/9964cb37c5ad577c67d35d7ed7f12d97.jpg" style="margin: 0; width: 100%;" alt="" />
<p style="font-size: 12px; margin: 0;">PikWizard</p>
</a>
</span>
</span>
Free (free of charge)
Free for personal and commercial use.
Author: People Creations
Similar Free Stock Images

Premium


Premium


Premium


Premium


Premium


Premium


Premium


Premium


Premium


Premium


Premium


Premium


Premium


Premium


Premium


Premium

Premium


Premium


Premium


Premium


Premium

Premium


Premium


Premium


Premium


Explore More Free Stock Images