- Home >
- Stock Photos >
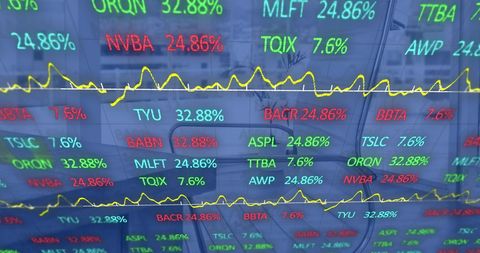
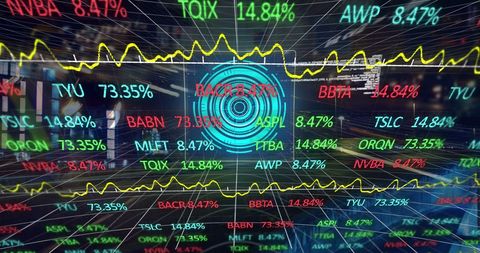
- Holographic Digital Stock Market Display with Graphs
Holographic Digital Stock Market Display with Graphs Image

This futuristic image showcases a digital stock market display with overlapping graphs and holographic elements, representing technological advancement in finance and trading. It is perfect for illustrating concepts related to digital trading, financial technology, market analysis, and economic reports. This visual could be used in presentations, articles or marketing materials related to finance and investment technologies.
Powered by 


2
downloads
downloads
Tags:
More
Credit Photo
If you would like to credit the Photo, here are some ways you can do so
Text Link
photo Link
<span class="text-link">
<span>
<a target="_blank" href=https://pikwizard.com/photo/holographic-digital-stock-market-display-with-graphs/309d352ddd0d001a661c8dece193eb78/>PikWizard</a>
</span>
</span>
<span class="image-link">
<span
style="margin: 0 0 20px 0; display: inline-block; vertical-align: middle; width: 100%;"
>
<a
target="_blank"
href="https://pikwizard.com/photo/holographic-digital-stock-market-display-with-graphs/309d352ddd0d001a661c8dece193eb78/"
style="text-decoration: none; font-size: 10px; margin: 0;"
>
<img src="https://pikwizard.com/pw/medium/309d352ddd0d001a661c8dece193eb78.jpg" style="margin: 0; width: 100%;" alt="" />
<p style="font-size: 12px; margin: 0;">PikWizard</p>
</a>
</span>
</span>
Free (free of charge)
Free for personal and commercial use.
Author: Awesome Content
Similar Free Stock Images
Loading...

Premium


Premium


Premium


Premium


Premium


Premium


Premium


Premium


Premium


Premium


Premium


Premium


Premium

Premium

Premium


Premium

Premium


Premium

Premium


Premium


Premium


Premium


Premium


Premium


Premium