- Home >
- Stock Photos >
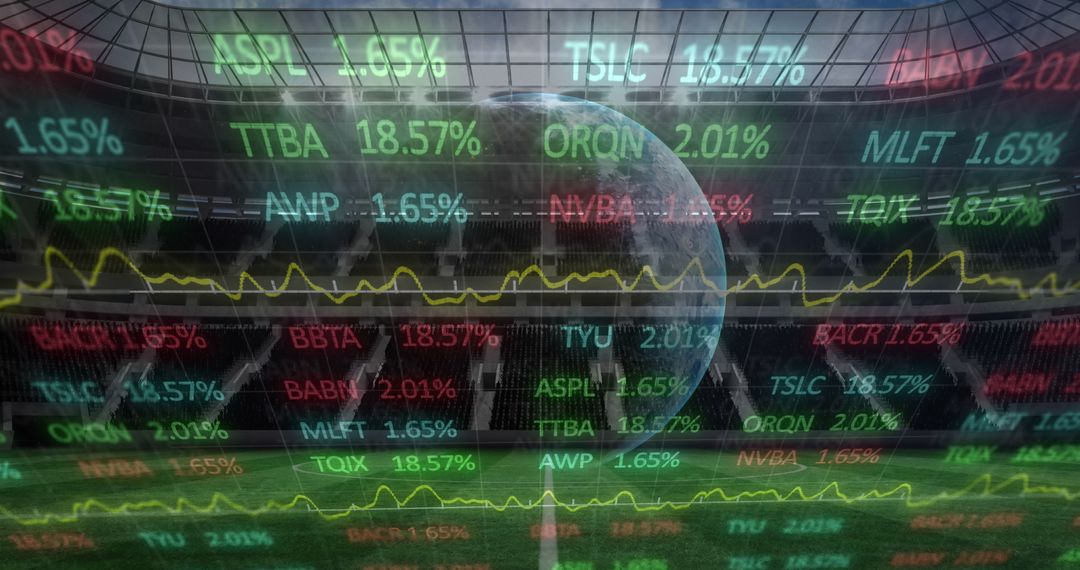
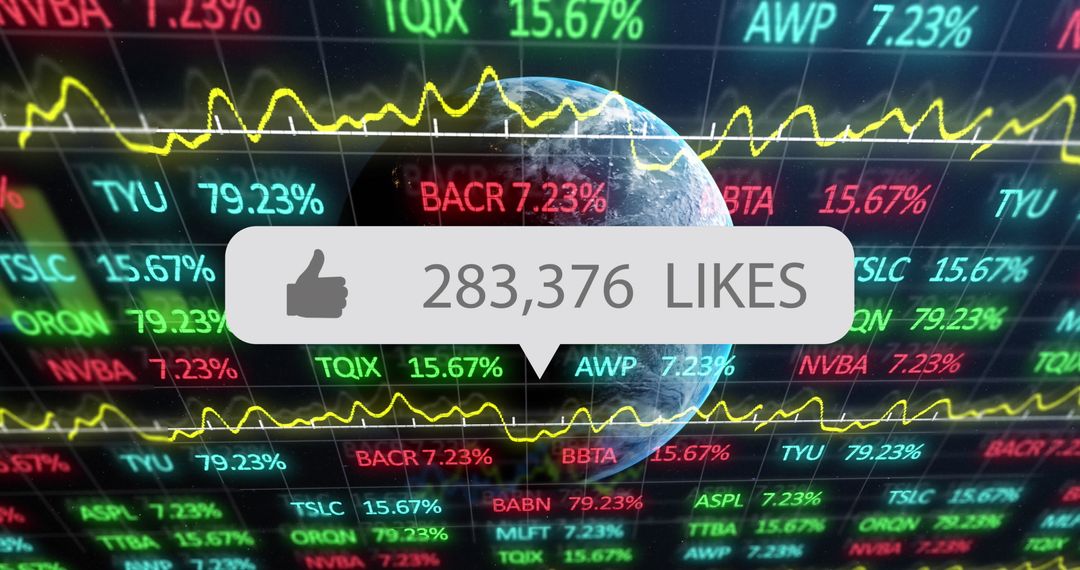
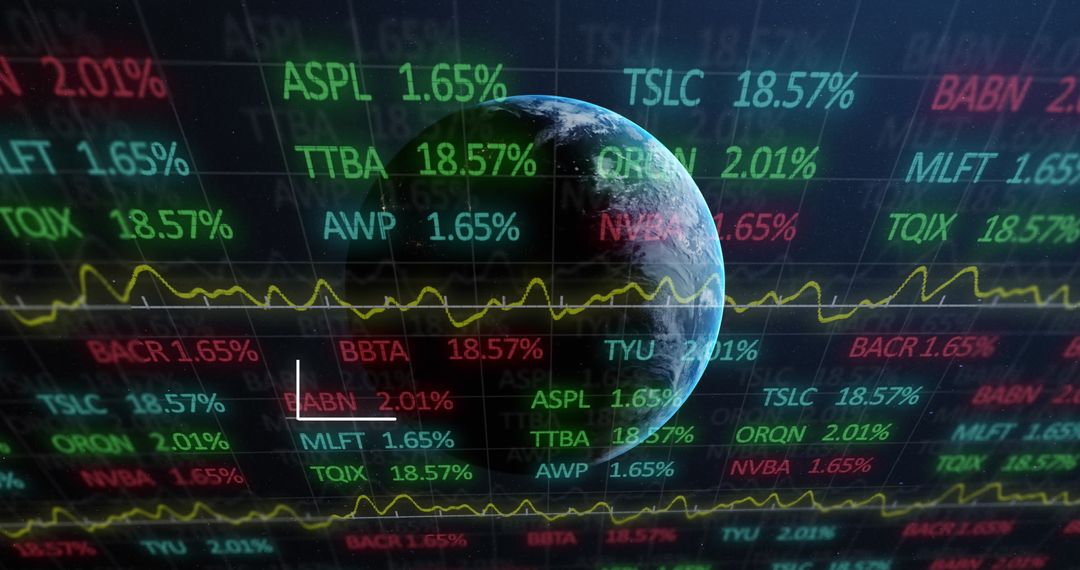
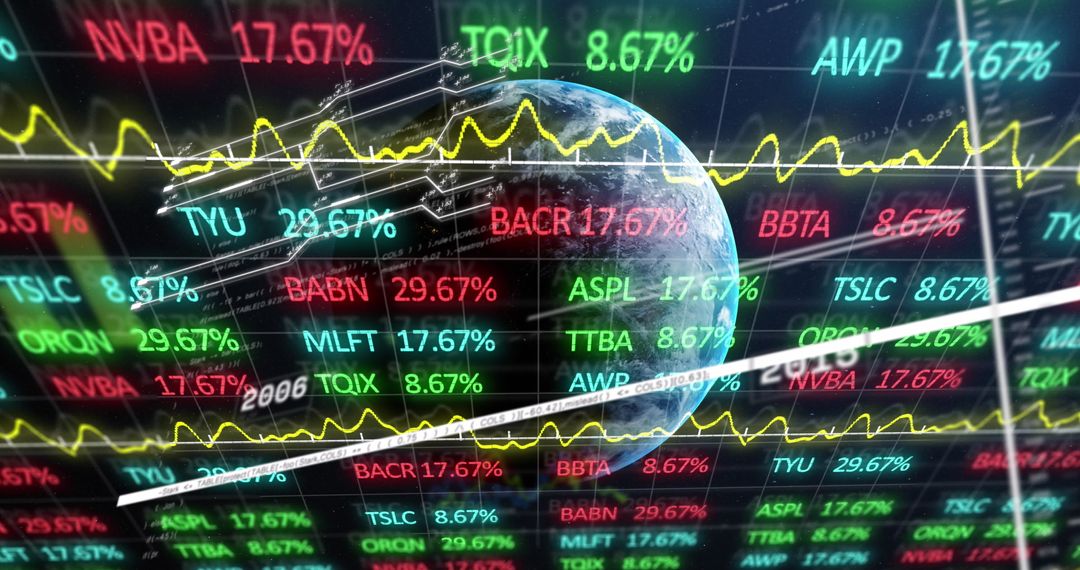
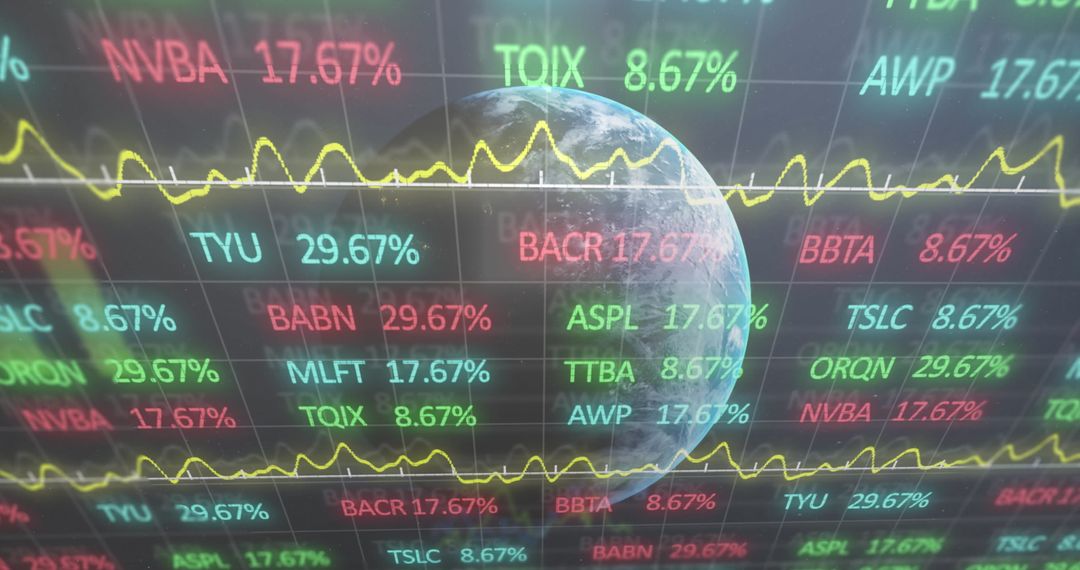
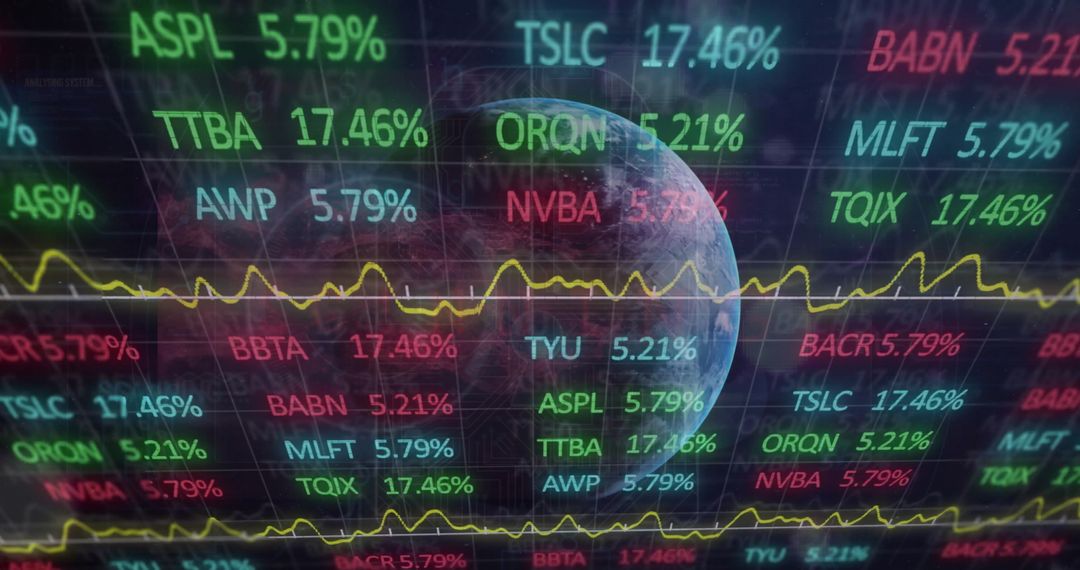
- Holographic Earth Overlay on Trading Dashboard Showing Global Market Data and Decline
Holographic Earth Overlay on Trading Dashboard Showing Global Market Data and Decline Image

Translucent Earth globe overlaying neon stock tickers and grid, yellow trend line and red downward arrow conveying market volatility. Suiting financial news headlines, market analysis articles, fintech website banners, trading platform mockups, and investor pitch decks. Working well as background for presentation slides, annual reports, social media posts, and infographics about global economy and market decline. Aiding brands by illustrating concepts like data visualization, global finance, economic risk, and real-time analytics.
Powered by 


0
downloads
downloads
Tags:
More
Credit Photo
If you would like to credit the Photo, here are some ways you can do so
Text Link
photo Link
<span class="text-link">
<span>
<a target="_blank" href=https://pikwizard.com/photo/holographic-earth-overlay-on-trading-dashboard-showing-global-market-data-and-decline/22765e88db059ac649226b3adfdb29f7/>PikWizard</a>
</span>
</span>
<span class="image-link">
<span
style="margin: 0 0 20px 0; display: inline-block; vertical-align: middle; width: 100%;"
>
<a
target="_blank"
href="https://pikwizard.com/photo/holographic-earth-overlay-on-trading-dashboard-showing-global-market-data-and-decline/22765e88db059ac649226b3adfdb29f7/"
style="text-decoration: none; font-size: 10px; margin: 0;"
>
<img src="https://pikwizard.com/pw/medium/22765e88db059ac649226b3adfdb29f7.jpg" style="margin: 0; width: 100%;" alt="" />
<p style="font-size: 12px; margin: 0;">PikWizard</p>
</a>
</span>
</span>
Free (free of charge)
Free for personal and commercial use.
Author: Authentic Images
Similar Free Stock Images

Premium


Premium


Premium


Premium


Premium


Premium


Premium


Premium


Premium


Premium


Premium


Premium


Premium


Premium


Premium


Premium


Premium


Premium


Premium


Premium


Premium


Premium


Premium


Premium