
- Home >
- Stock Photos >
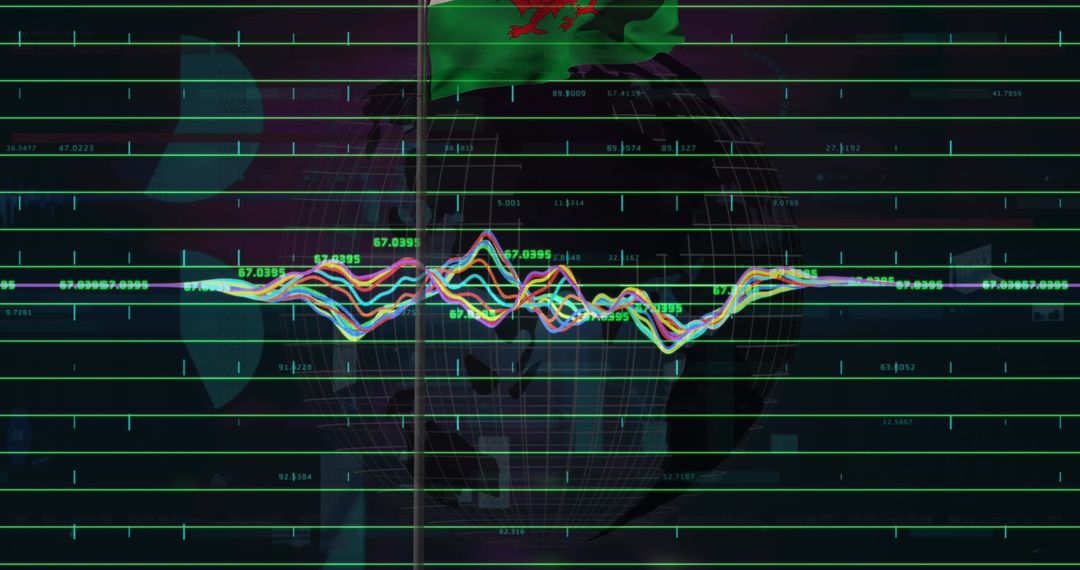
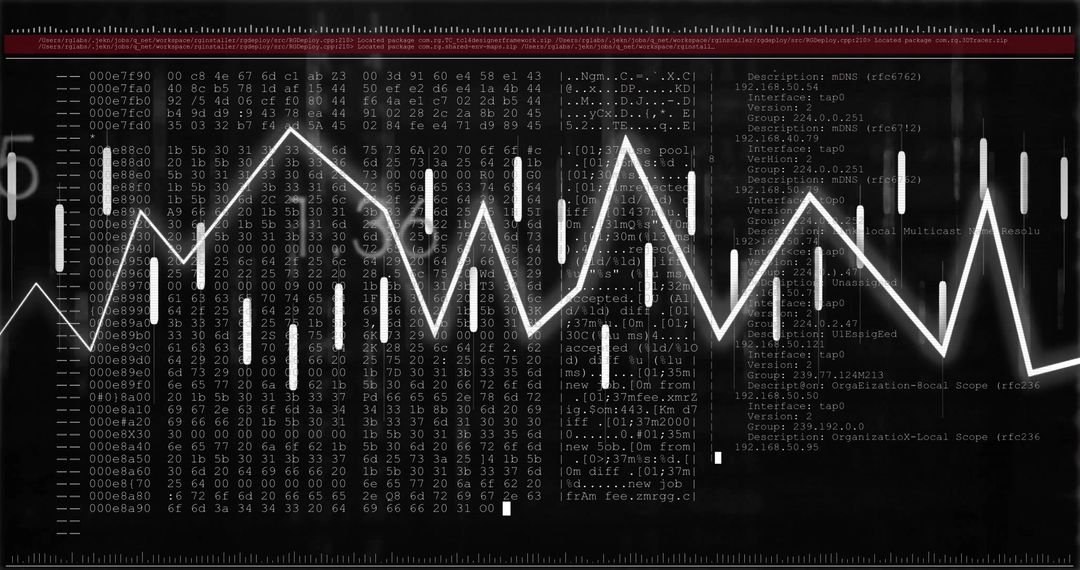
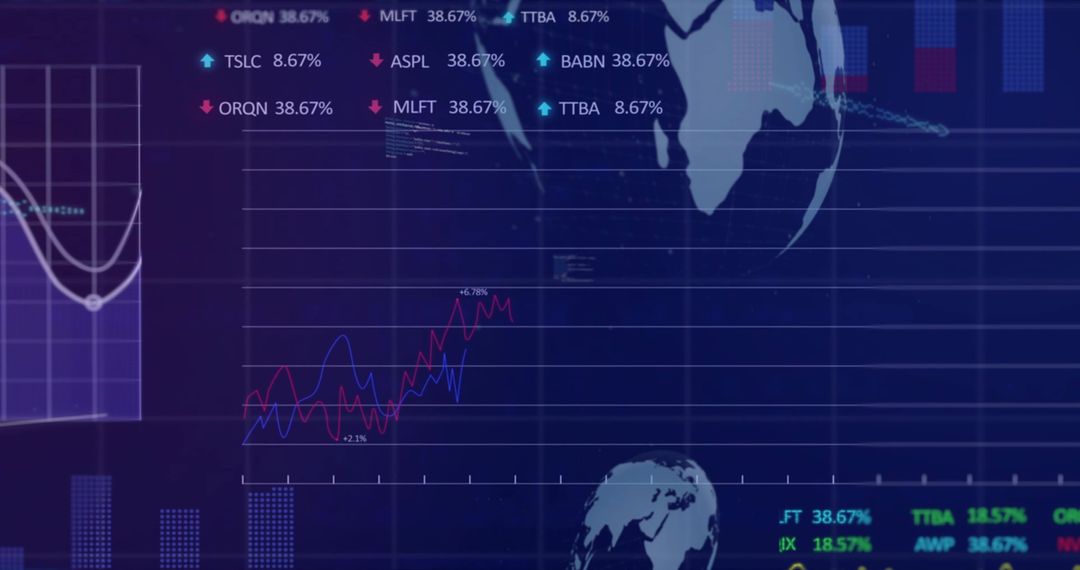
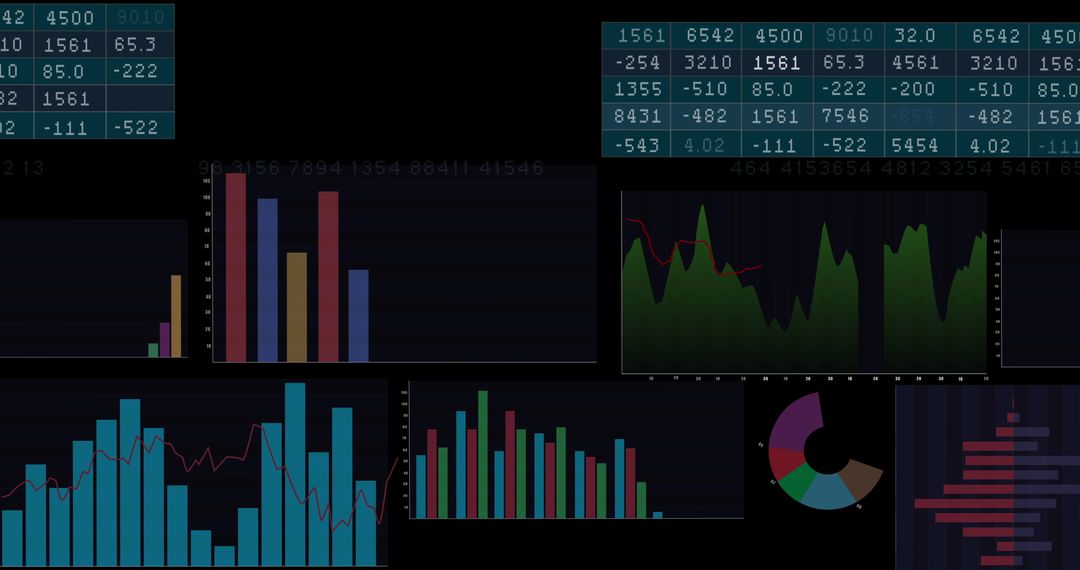
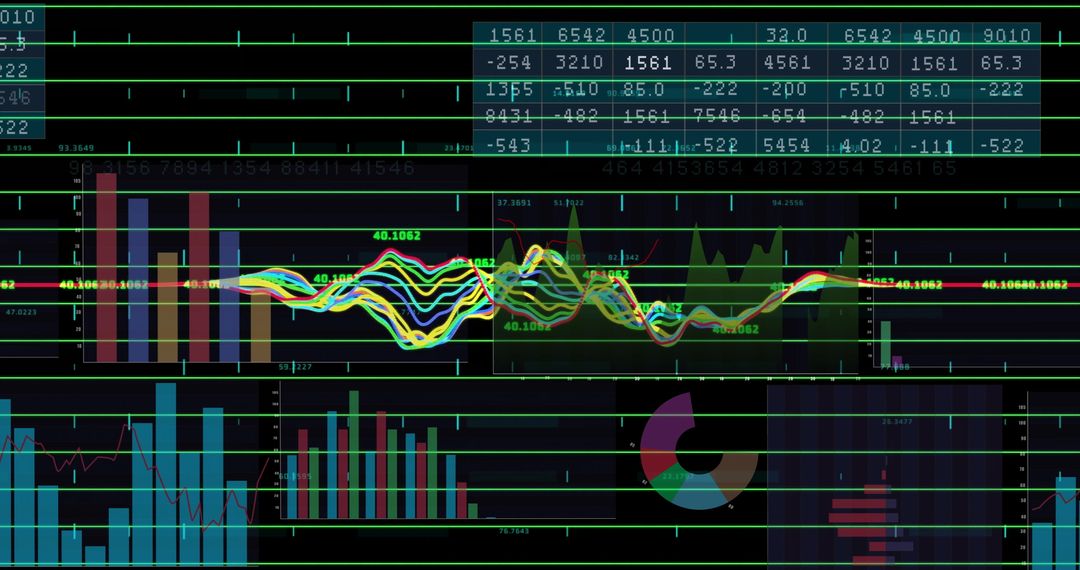
- Holographic Finance Dashboard Displaying Glitchy Neon Data Streams, Binary Overlay
Holographic Finance Dashboard Displaying Glitchy Neon Data Streams, Binary Overlay Image

Dark holographic finance dashboard displaying translucent panels, bar charts, line graphs, binary digits, and world map silhouette. Glitchy neon accents in teal, magenta, green creating futuristic tech mood. Visual elements layering for depth and motion and simulating realtime data flow. Composition suiting hero banners, website headers, fintech presentations, market analysis reports, cybersecurity blogs, and app UI mockups. Cropping for widescreen headers or square social posts recommended. Overlaying high-contrast text or logo with subtle gradient mask improving legibility. Ideal for conveying data analytics, trading, big data, digital security, and tech innovation themes.
Powered by  - Get 15% off with code: PIKWIZARD15


0
downloads
downloads
Tags:
More
Credit Photo
If you would like to credit the Photo, here are some ways you can do so
Text Link
photo Link
<span class="text-link">
<span>
<a target="_blank" href=https://pikwizard.com/photo/holographic-finance-dashboard-displaying-glitchy-neon-data-streams-binary-overlay/a4b3012ce38d661f04dfba328fa494fc/>PikWizard</a>
</span>
</span>
<span class="image-link">
<span
style="margin: 0 0 20px 0; display: inline-block; vertical-align: middle; width: 100%;"
>
<a
target="_blank"
href="https://pikwizard.com/photo/holographic-finance-dashboard-displaying-glitchy-neon-data-streams-binary-overlay/a4b3012ce38d661f04dfba328fa494fc/"
style="text-decoration: none; font-size: 10px; margin: 0;"
>
<img src="https://pikwizard.com/pw/medium/a4b3012ce38d661f04dfba328fa494fc.jpg" style="margin: 0; width: 100%;" alt="" />
<p style="font-size: 12px; margin: 0;">PikWizard</p>
</a>
</span>
</span>
Free (free of charge)
Free for personal and commercial use.
Author: Authentic Images
Similar Free Stock Images

Premium


Premium


Premium


Premium


Premium


Premium


Premium


Premium


Premium


Premium


Premium


Premium


Premium


Premium


Premium


Premium


Premium


Premium


Premium


Premium


Premium


Premium


Premium


Premium

