
- Home >
- Stock Photos >
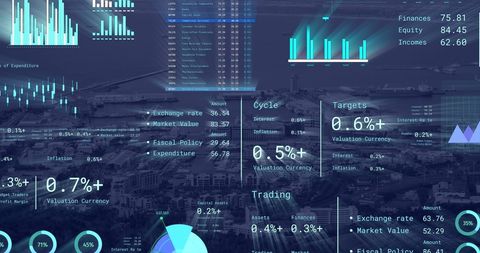
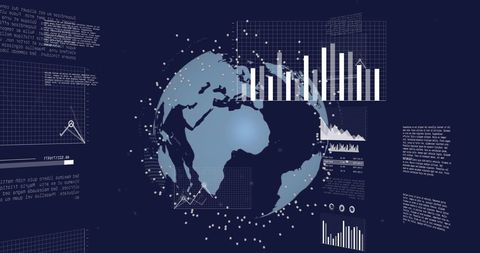
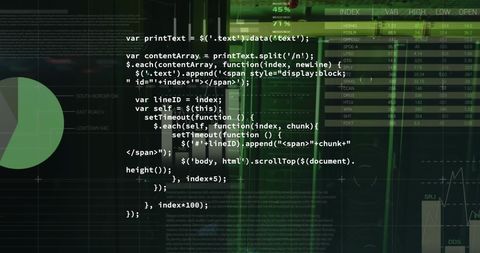
- Holographic Financial Analysis Display with Graphs and Data
Holographic Financial Analysis Display with Graphs and Data Image

The content showcases a dynamic digital display of various graphs, analytical reports, and a trading board on a blue background. This representation of data synthesis is indicative of financial sectors, investment subject matter, and business analytics. Suitable for creating engaging visual material for presentations, articles on financial markets, or technology developments in data visualization.
Powered by 


downloads
Tags:
More
Credit Photo
If you would like to credit the Photo, here are some ways you can do so
Text Link
photo Link
<span class="text-link">
<span>
<a target="_blank" href=https://pikwizard.com/photo/holographic-financial-analysis-display-with-graphs-and-data/baec5fa8950dfa2db7e2cfd74e1dd9de/>PikWizard</a>
</span>
</span>
<span class="image-link">
<span
style="margin: 0 0 20px 0; display: inline-block; vertical-align: middle; width: 100%;"
>
<a
target="_blank"
href="https://pikwizard.com/photo/holographic-financial-analysis-display-with-graphs-and-data/baec5fa8950dfa2db7e2cfd74e1dd9de/"
style="text-decoration: none; font-size: 10px; margin: 0;"
>
<img src="https://pikwizard.com/pw/medium/baec5fa8950dfa2db7e2cfd74e1dd9de.jpg" style="margin: 0; width: 100%;" alt="" />
<p style="font-size: 12px; margin: 0;">PikWizard</p>
</a>
</span>
</span>
Free (free of charge)
Free for personal and commercial use.
Author: Authentic Images
Similar Free Stock Images

Premium


Premium


Premium


Premium


Premium


Premium


Premium


Premium


Premium


Premium


Premium


Premium


Premium


Premium

Premium


Premium

Premium


Premium

Premium


Premium


Premium


Premium


Premium

Premium


Premium

Explore More Free Stock Images