1. Home > 
  2. Stock Photos > 
  3. Holographic financial analytics dashboard displaying neon code with rising line charts

Holographic financial analytics dashboard displaying neon code with rising line charts Image

Holographic financial analytics dashboard displaying neon code with rising line charts

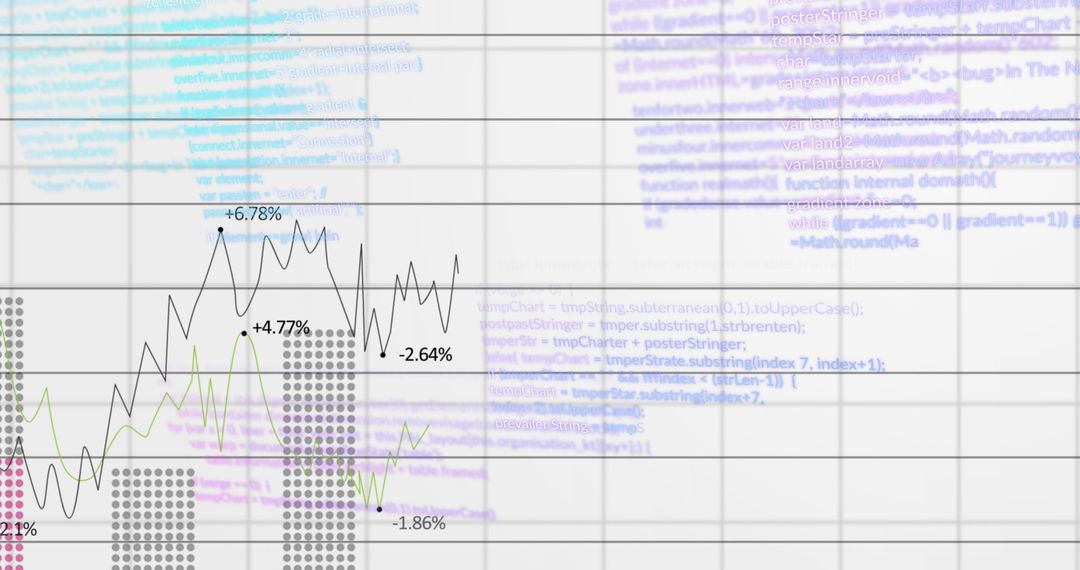
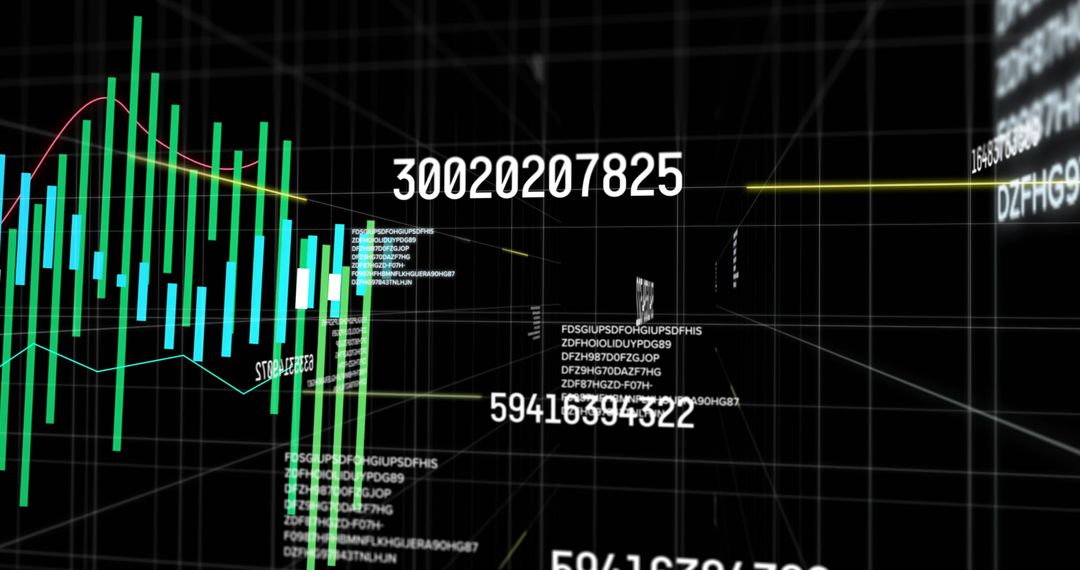
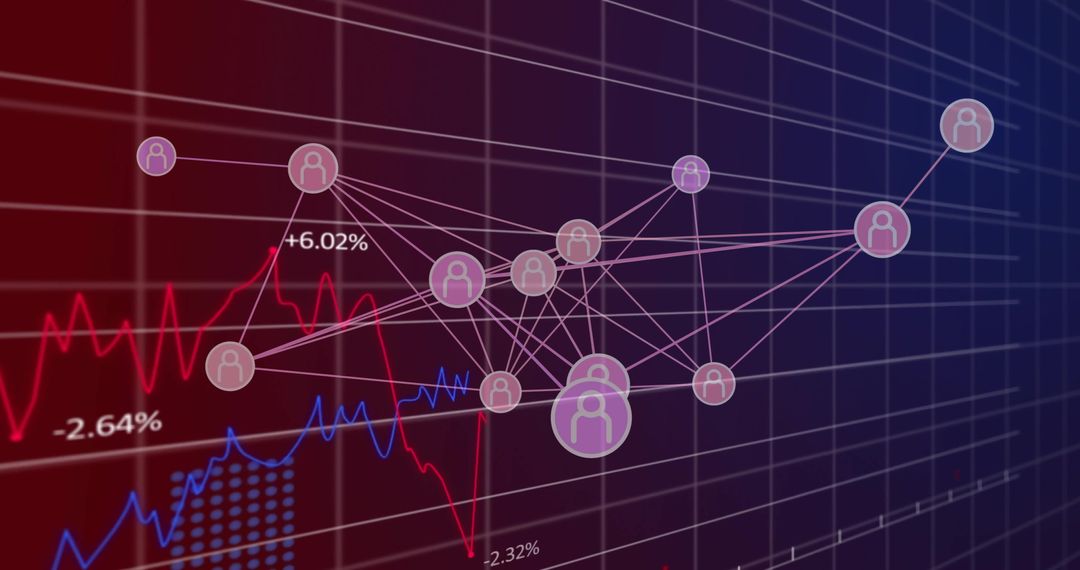
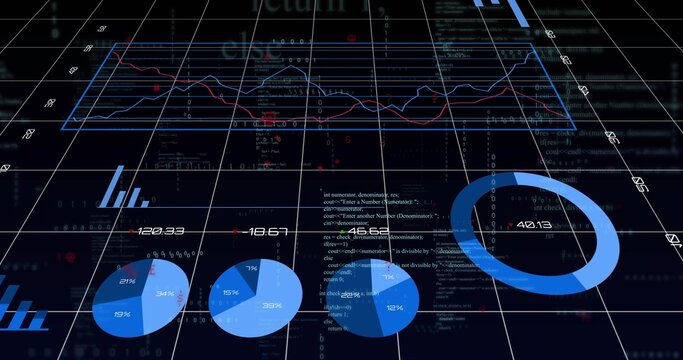
Holographic analytics dashboard showing neon code overlay and rising line charts, blending financial data with programming elements. Blue upward line and red market trends presenting percent change labels, grid and heatmap providing depth and motion. Neon color palette using red, blue, purple creating futuristic technology mood. Visual working well for website headers, fintech presentations, investor reports, technology blogs, developer portfolios, and marketing materials. Visual serving as background for articles about algorithmic trading, data science, machine learning, and digital transformation. Editable composition allowing color adjustments and layer masking for brand alignment; cropping to wide banner or square format suggested for social media use.

Powered by Adobe logo
Dynamic financial data visualization overlays a vibrant, bokeh-lit cityscape at night, symbolizing growth and market trends. - Powered by AdobeA financial and marketing KPI dashboard for business analytics and strategy. A report showing profit, revenue, and customer conversion rate data. Motif - Powered by AdobeFinancial market data analysis with glowing 3D bar and line charts on dark background showing economic trends and growth concept visualization. 3D Rendering - Powered by AdobeVisualize dynamic data streams and growth charts on futuristic holographic displays showing business analytics and financial trends for modern strategy. - Powered by AdobeFinancial data analytics dashboard with charts and graphs on digital screen - Powered by Adobe

Credit Photo

If you would like to credit the Photo, here are some ways you can do so

Free (free of charge)

Free for personal and commercial use.

Author: Authentic Images

Similar Free Stock Images

Digital Stock Market Data Visualization with Rising and Falling Prices
Premium
Data analyzing and stock market visualization with digital charts, financial dashboards, and performance metrics. Ideal for investment analysis, trading strategy, and economic forecasting.
Cybersecurity Concept with Digital Lock and Computer Code
Financial Data Over Grid Indicating Market Trends and Analytics
Financial Graphs with Cityscape Background Reflecting Market Trends
Digital Code and Graphs on Gradient Background
Premium
Global financial trading chart with glowing blue bars and world map on digital interface background illustrating business data and economy concept. Ai generative
Dynamic Financial Data Charts on Dark Digital Background
Digital Data Visualization with Futuristic Infographics
Digitized Financial Data Analysis with Graphs and Codes
Dynamic Notification Interface with Stocks and Social Media Alerts
Premium
Data Analysis and Reporting. Business professional analyzing financial charts on laptop.
Stock Market Trends and Data Analysis over Digital Grid
Digital Financial Graph Illustrating Stock Market Trends
Soundwave Visualization and Data Analysis on Digital Grid
Digital Financial Data Analysis and Stock Market Charting
Premium
Diverse business professionals analyzing financial data visualization charts on a large monitor isolated on transparent background
Global Financial Data Analysis on Grid Background
Data Processing Overlaid on Graphs and Code in Digital Interface
Digital Data Analytics Growth Trend with Graphs
Financial Data Analytics Over Digital Grid Screen
Premium
Businessman analyzing financial data on futuristic digital screen with graphs and charts on a dark background, showcasing the finance growth concept.
Dynamic Financial Data Growth Chart Display
Financial Data Charts with Viewing Grid in Dark Perspective
Dynamic Financial Graph with Data Analysis Conceptual Background
Digital Data Visualization and Code on Modern Interface
Premium
Upward market arrow on digital chart expressing business growth financial performance improvement and confident data driven strategy execution.
Digital Dashboard Displaying Financial Chart and Analytics Interface
Financial Data Dashboard Displaying Dual Trend Lines, Percentage Labels Interactive Metrics
Neon code cluster floating over translucent green grid interface glowing data visualization
Market dashboard displaying candlestick chart, volume profile and moving averages
Colorful Stock Market Display with Graphs and Tickers on Blue Background
Financial Data Graphs Over Cityscape Indicating Global Business Concept
Premium
Futuristic data center with glowing servers and 3D financial chart overlay.
Ukraine Crisis Financial Graphs Overlay
Dynamic Financial Charts with Blue Digital Interface
Digital Data Processing on Dynamic Green Background
Digital Financial Data Interface on Green Background
Premium
Man working on laptop with orange holographic charts in a futuristic office environment setting
Data Analytics and Stock Market Graphs
Abstract Financial Market Data with CGI and Code Overlay
Digital Data Analysis Interface with Graphs
Global Financial Trends and Digital Data Visualization Concepts
Premium
Dynamic digital financial graph with glowing purple and blue trend lines on dark background displaying market analytics data for investment technology
Stock Market Graph and Data Analysis
Soundwaves with Graph Overlays in Data Processing Concept
Global Financial Data Processing with Digital Interface Elements
Digital Head Silhouette with Code Representing AI Technology
Premium
Futuristic bar chart data growth digital analytics business concept transparent tablet augmented reality financial success innovation modern technology entrepreneur
Digital Financial Graphs and Business Analytics on Blue Backdrop
Digital Display of Financial Data with Graph and Figures
Financial Stock Market Trends Over Digital Grid Background
Global Currency Symbols and Financial Network Graph
Premium
Business professional examining rising growth charts on digital screens representing financial success and corporate performance analytics
Abstract Digital Financial Data Graph Chart
Digital Graph and Data Analysis with Financial Growth Trends
Financial Analytics Dashboard with Growth Trends and Indicators
Interactive 3D Graph with Digital Numeric Overlay
Premium
AI data analytics dashboard, business data insights, AI-powered data analysis dashboard, business strategy, Analyst or Scientist uses a computer and dashboard for analysis of information development
Financial Market Dashboard Showing Rising Candlestick Cluster with Sector Icons and Data
Neon Finance Dashboard Featuring Time-Series Lines, Dotted Bars and Live Market Tickers
Futuristic Financial Dashboard Showing Layered Market Charts and Colored Trend Lines
Dynamic Financial Data and Stock Market Interface
Digital Financial Data and Dynamic Stock Market Graphs
Futuristic Data Visualization Interface with Global Network Map
Premium
Futuristic glowing blue digital dashboard with interactive charts graphs and analytics showing upward growth trend for business financial and technology data visualization concepts
Dynamic Financial Data and Graphs on Digital Interface
Digital Code Flow on Grid Background
Trending Financial Graphs with Red and Blue Analytics Lines
Financial Data Analysis Graph with Growing Trends
Premium
Marketing Manager Using Laptop
Digital Finance Data Overload with Code and Graphs
Dynamic Statistical Data Analysis on Digital Grid Network
Global Data Processing Technology on Digital Grid
Digital Financial Graphs and Market Data Analysis
Premium
confident businessman in suit holding tablet and presenting glowing blue and orange holographic financial chart and data visualization above his hand against a blurred digital background
Digital Soundwaves with Data Graphs and Coding Elements
Dynamic Stock Market Graph with Percentage Indicators
Financial Data Visualization with Increasing Graph Trend
Dynamic Financial Data with Global Connections and Insights
Premium
Futuristic business intelligence dashboard interface with financial data visualization for
Network of Connections and Financial Data on Graph
Financial Data Analysis with Growing Stock Trends
Cybersecurity Threat Alert with Malware Concept on Digital Grid
Digital Stock Market Data and Financial Charts Interface
Premium
Colorful stock market dashboard with financial data and graphs, generative ai
Futuristic Data Visualization with Dynamic Graphs
Futuristic Network Grid with Code and Connections on Display
Financial Charts with Blue and Red Lines and Digital Percent Indicators
Digital Code Interface with Graphs on Blue Background
Premium
Neon pink and blue financial data visualization with glowing line chart and bokeh lights
Futuristic financial dashboard displaying layered stock charts, red and blue trend lines
Holographic Code Stream Visualizing Real-Time Data Analytics on Neon Grid
Digital Financial Data Stream with Numeric Overlay
Digital Financial Data with Trending Arrows
Digital Code Reflection in Grid Overlay Business Interface
Global Financial Markets and Technology Analysis
Premium
Displaying data visualizations on analytics dashboard, with line graph pie charts donut chart
Financial Data Display in Digital Grid Design
Financial Data Visualization on Digital Grid
Financial Data Analysis with Code Interface on Black Background
Financial Data Processing Over Digital Grid with Code Elements
Premium
Close-up of a digital display showing various charts and graphs in blue and orange hues, representing data analysis and business intelligence, ideal for technology or financial concepts
Stock Market Data Visuals Displaying Financial Analysis Trends
Statistical Data and Trends Over Digital Grid Overlay
Colorful Data Analytics Bar Graphs on Digital Screen
Data Analytics with Dynamic Global Market Trends on Screen
Premium
Businessman using digital tablet to analyze data with futuristic dashboard, financial charts, symbolizing innovation, big data, business intelligence, digital transformation, financial analytics
Stock Market Graph with Social Media Notifications Overlay
Cyber Code on Dark Grid Matrix Background
Statistics and Data Processing with Graphs and Charts
Digital Financial Data Processing with Trend Lines
Premium
A financial and marketing KPI dashboard for business analytics and strategy. A report showing profit, revenue, and customer conversion rate data. Motif
Abstract Financial Chart with Rising and Falling Indicators
Animated Financial Graph with Candlestick Chart
Financial Data Graphic with Rising Trends on Digital Grid
FinTech Global Data Chart with Statistical Analysis
Premium
Colorful bar graph depicting business growth on black background with glowing neon lines and gradient colors for data visualization concept.
Digital Candlestick Chart with Percentages and Analytics Lines
Digital Analytics Graph with Futuristic 3D Interface
Futuristic Waveform Display on Virtual Trading Dashboard
Neon Analytics Dashboard Showing Rising Blue Trend Line, Red Volatility, Dotted Bars
Premium
Global data analysis dashboard with world map and charts for business intelligence and financial reporting in a stunning modern interface
Subscriber Analytics Dashboard with Candlestick Charts and Line Graphs Showing 477,785 Subscribers