- Home >
- Stock Photos >
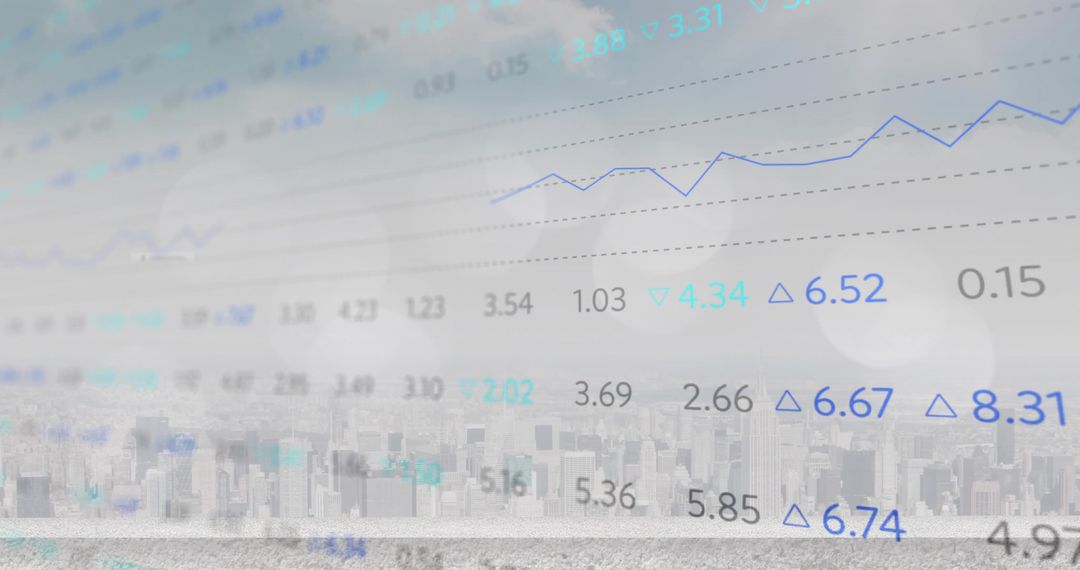
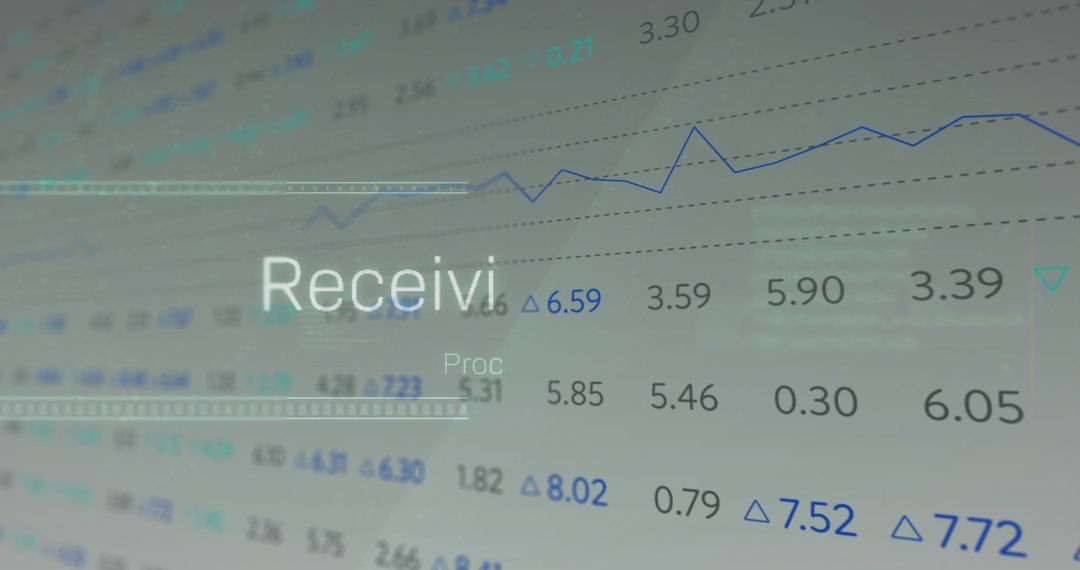
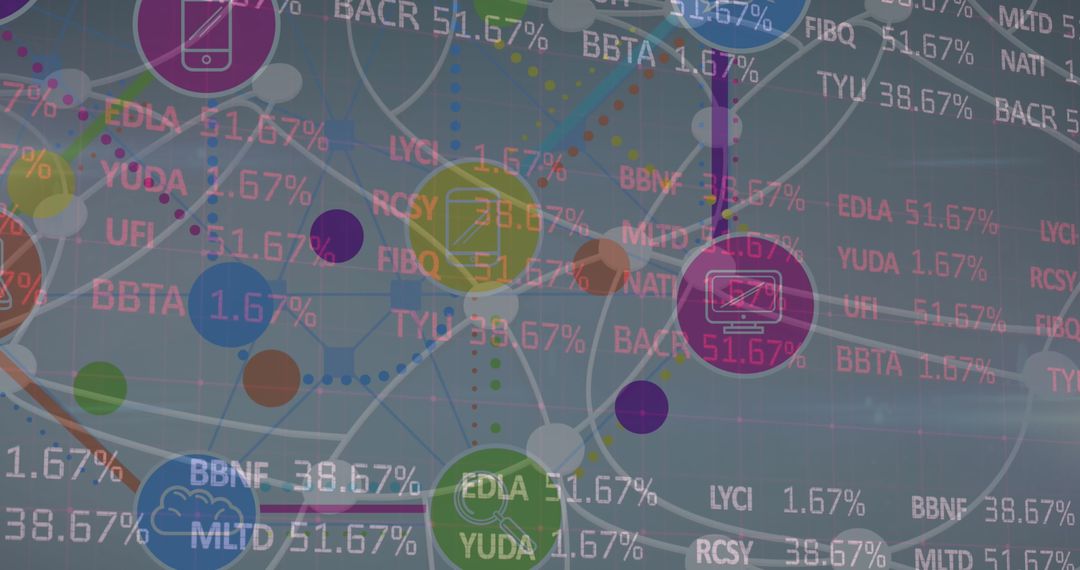
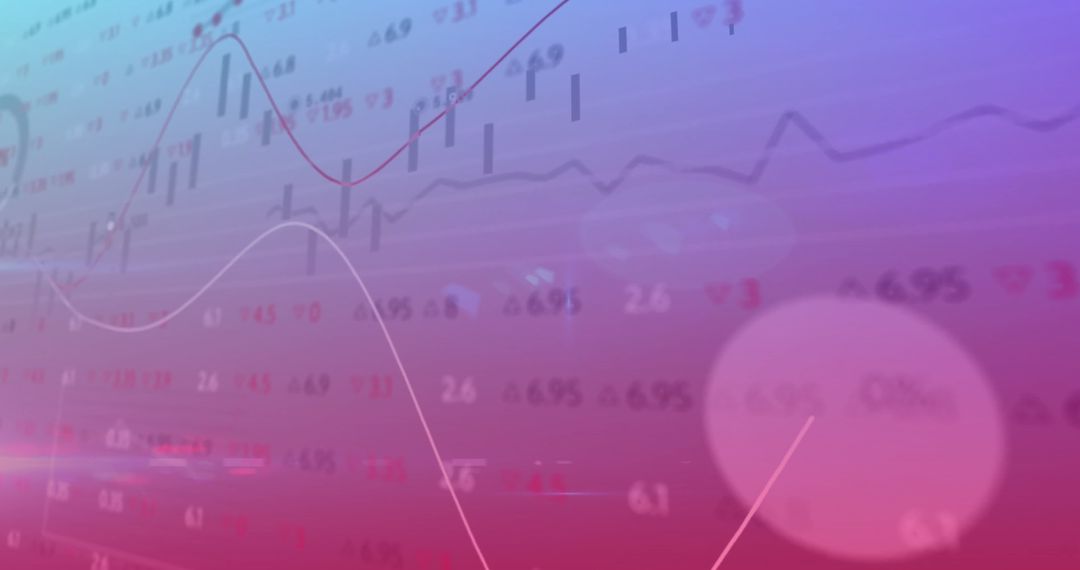
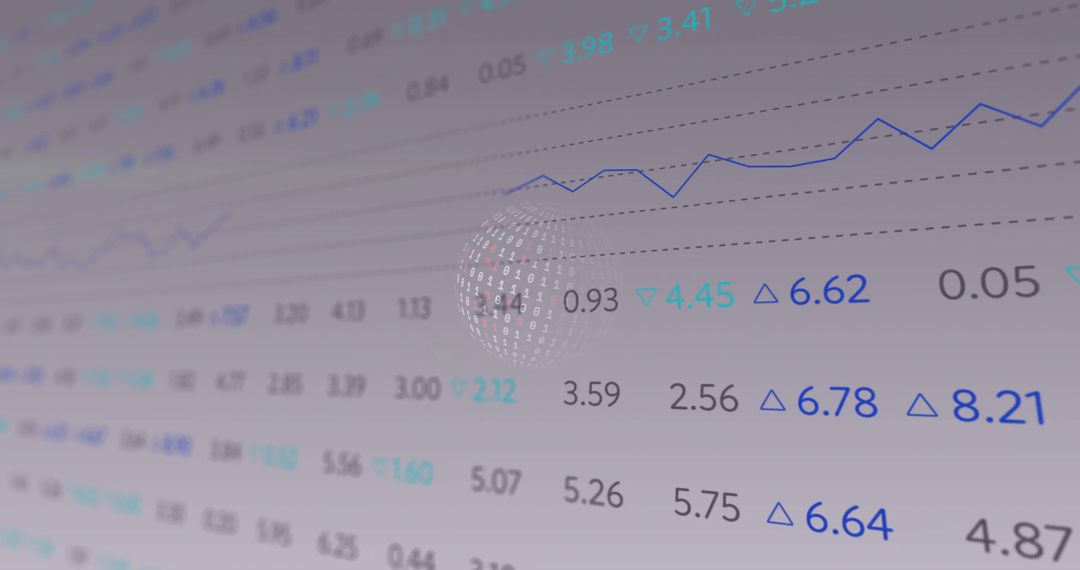
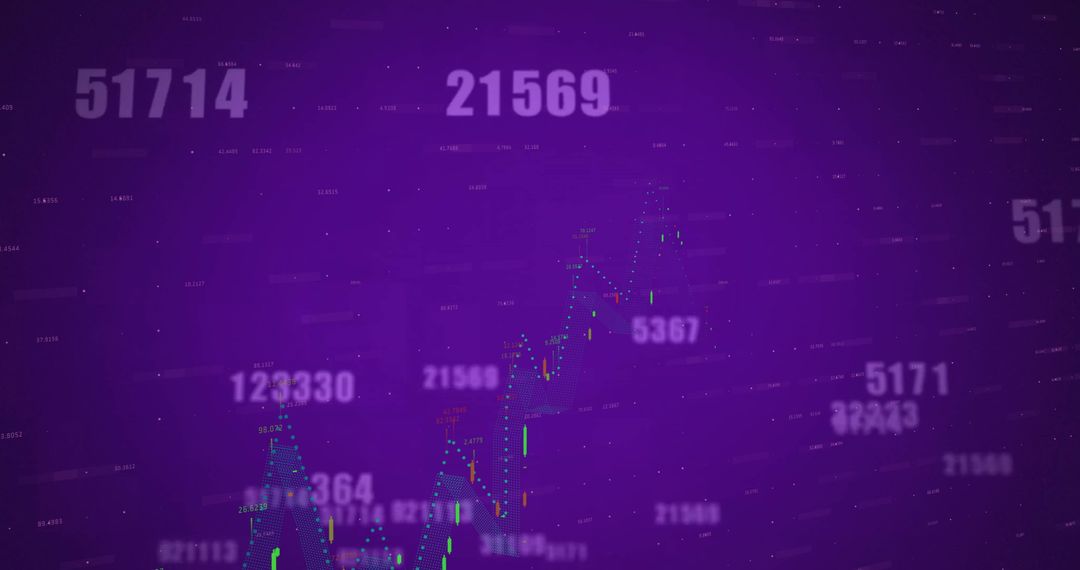
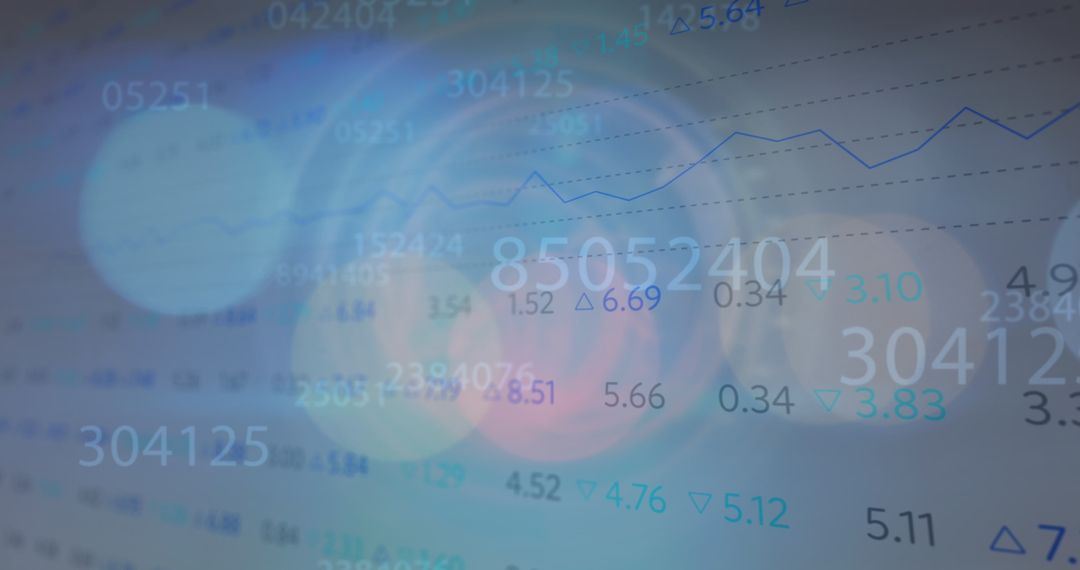
- Holographic Financial Dashboard Showing Floating Numeric Overlays, Line Chart and Bokeh
Holographic Financial Dashboard Showing Floating Numeric Overlays, Line Chart and Bokeh Image

Showing translucent numeric overlay on glassy dashboard with blue line chart, delta indicators, and soft purple bokeh. Working well for finance websites, investment pitch decks, annual reports, fintech product pages, data analytics blog posts, UI/UX concept boards, market research presentations. Enhancing hero banners, header graphics, social media visuals, slide decks, explainer videos. Conveying high-tech mood, transparent interface aesthetic, data-driven decision making, market trend analysis, portfolio performance tracking. Recommending crop for horizontal hero or widescreen header; leaving negative space at left for headline and call-to-action; using high-contrast overlay or blur to ensure legible text; matching color grading to brand palette; pairing with clean sans-serif typography.
Powered by  - Get 15% off with code: PIKWIZARD15


0
downloads
downloads
Tags:
More
Credit Photo
If you would like to credit the Photo, here are some ways you can do so
Text Link
photo Link
<span class="text-link">
<span>
<a target="_blank" href=https://pikwizard.com/photo/holographic-financial-dashboard-showing-floating-numeric-overlays-line-chart-and-bokeh/1125a5be1a92663baf710f0995d961b3/>PikWizard</a>
</span>
</span>
<span class="image-link">
<span
style="margin: 0 0 20px 0; display: inline-block; vertical-align: middle; width: 100%;"
>
<a
target="_blank"
href="https://pikwizard.com/photo/holographic-financial-dashboard-showing-floating-numeric-overlays-line-chart-and-bokeh/1125a5be1a92663baf710f0995d961b3/"
style="text-decoration: none; font-size: 10px; margin: 0;"
>
<img src="https://pikwizard.com/pw/medium/1125a5be1a92663baf710f0995d961b3.jpg" style="margin: 0; width: 100%;" alt="" />
<p style="font-size: 12px; margin: 0;">PikWizard</p>
</a>
</span>
</span>
Free (free of charge)
Free for personal and commercial use.
Author: Authentic Images
Similar Free Stock Images
Premium


Premium


Premium


Premium


Premium


Premium


Premium


Premium


Premium


Premium


Premium


Premium


Premium


Premium


Premium


Premium


Premium


Premium


Premium


Premium


Premium


Premium


Premium


Premium