- Home >
- Stock Photos >
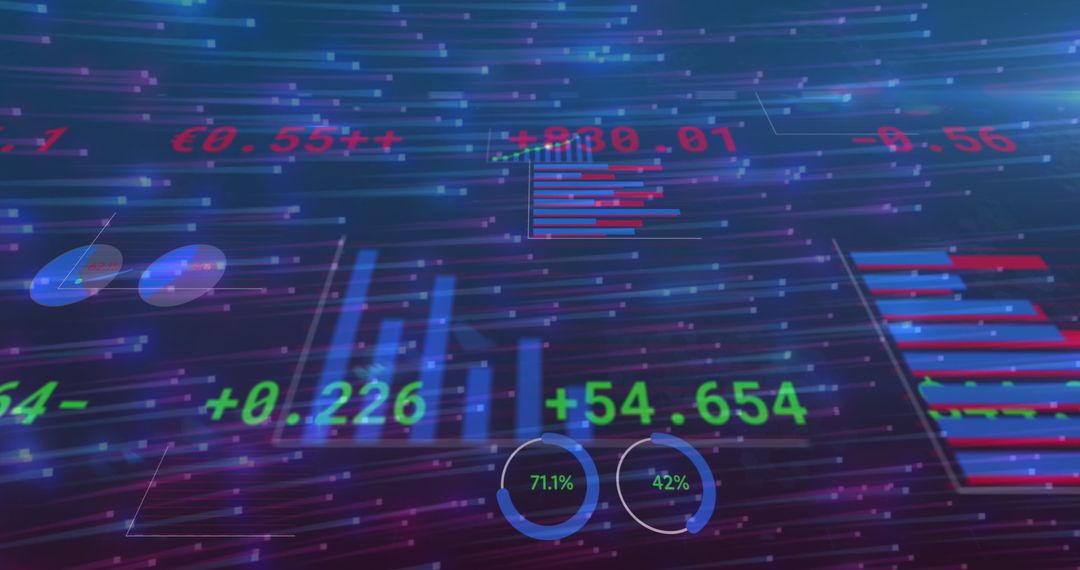
- Holographic Financial Data Display with Charts and Graphs
Holographic Financial Data Display with Charts and Graphs Image

Offering a visual representation of financial information on a modern holographic interface, featuring a dynamic array of tickers, charts, and percentage graphs amidst a futuristic grid and binary backdrop. This digital scene conveys a cutting-edge approach to business analytics and technology integration. Ideal for presentations about financial technology advancements, stock market analytics tools, or innovative business solutions.
Powered by 


2
downloads
downloads
Tags:
More
Credit Photo
If you would like to credit the Photo, here are some ways you can do so
Text Link
photo Link
<span class="text-link">
<span>
<a target="_blank" href=https://pikwizard.com/photo/holographic-financial-data-display-with-charts-and-graphs/9fa9fdb2bad21c8f8bdf24975a081226/>PikWizard</a>
</span>
</span>
<span class="image-link">
<span
style="margin: 0 0 20px 0; display: inline-block; vertical-align: middle; width: 100%;"
>
<a
target="_blank"
href="https://pikwizard.com/photo/holographic-financial-data-display-with-charts-and-graphs/9fa9fdb2bad21c8f8bdf24975a081226/"
style="text-decoration: none; font-size: 10px; margin: 0;"
>
<img src="https://pikwizard.com/pw/medium/9fa9fdb2bad21c8f8bdf24975a081226.jpg" style="margin: 0; width: 100%;" alt="" />
<p style="font-size: 12px; margin: 0;">PikWizard</p>
</a>
</span>
</span>
Free (free of charge)
Free for personal and commercial use.
Author: Creative Art
Similar Free Stock Images

Premium


Premium


Premium


Premium


Premium


Premium


Premium


Premium


Premium


Premium


Premium


Premium


Premium


Premium


Premium


Premium


Premium


Premium


Premium


Premium


Premium


Premium


Premium


Premium