- Home >
- Stock Photos >
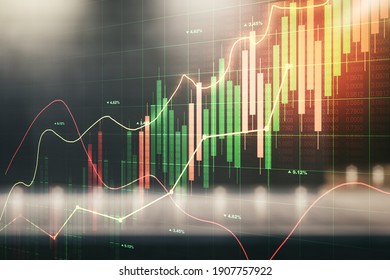
- Holographic Financial Data Visualization with Stock Trends
Holographic Financial Data Visualization with Stock Trends Image

Digitally generated visualization showing various financial data such as graphs, charts, and stock symbols. Represents modern technology's role in business analytics and stock trading. Useful for illustrating financial analysis, tech investment, and corporate growth strategies.
Powered by  - Get 15% off with code: PIKWIZARD15


2
downloads
downloads
Tags:
More
Credit Photo
If you would like to credit the Photo, here are some ways you can do so
Text Link
photo Link
<span class="text-link">
<span>
<a target="_blank" href=https://pikwizard.com/photo/holographic-financial-data-visualization-with-stock-trends/a66c02017227d5efeafa216a907662a0/>PikWizard</a>
</span>
</span>
<span class="image-link">
<span
style="margin: 0 0 20px 0; display: inline-block; vertical-align: middle; width: 100%;"
>
<a
target="_blank"
href="https://pikwizard.com/photo/holographic-financial-data-visualization-with-stock-trends/a66c02017227d5efeafa216a907662a0/"
style="text-decoration: none; font-size: 10px; margin: 0;"
>
<img src="https://pikwizard.com/pw/medium/a66c02017227d5efeafa216a907662a0.jpg" style="margin: 0; width: 100%;" alt="" />
<p style="font-size: 12px; margin: 0;">PikWizard</p>
</a>
</span>
</span>
Free (free of charge)
Free for personal and commercial use.
Author: Creative Art
Similar Free Stock Images

Premium


Premium


Premium


Premium


Premium


Premium


Premium


Premium


Premium


Premium


Premium


Premium


Premium


Premium


Premium


Premium


Premium


Premium


Premium


Premium


Premium


Premium


Premium


Premium